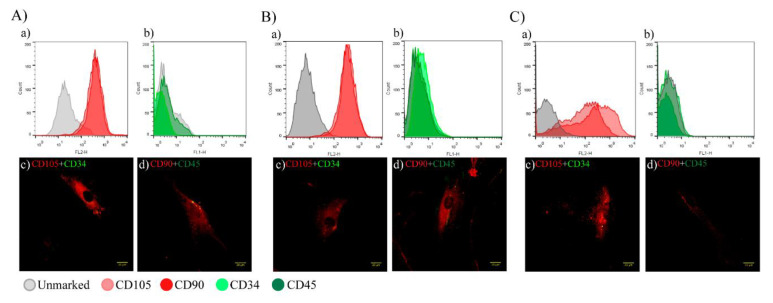
Figure 1.
Characterization of hAT-MSCs. (A–C) Images of flow cytometry and fluorescence microscopy of CD markers specific to hAT-MSCs (A = C0, B = C1, and C = C2). (Aa,Ba,Ca) CD105 and CD90 (positive in 70% of the cells). (Ab,Bb,Cb) CD34 and CD45 (unexpressed). The positive result was a peak fluorescence shift. These results were compared with C0 unstained (gray). Representative images of fluorescence microscopy, 40× objective: (Ac,Bc,Cc) Merged CD105 (red) and CD34 (green). (Ad,Bd,Cd) Merged CD90 (red) and CD45 (green). n = 3; scale bars = 20 µm.

