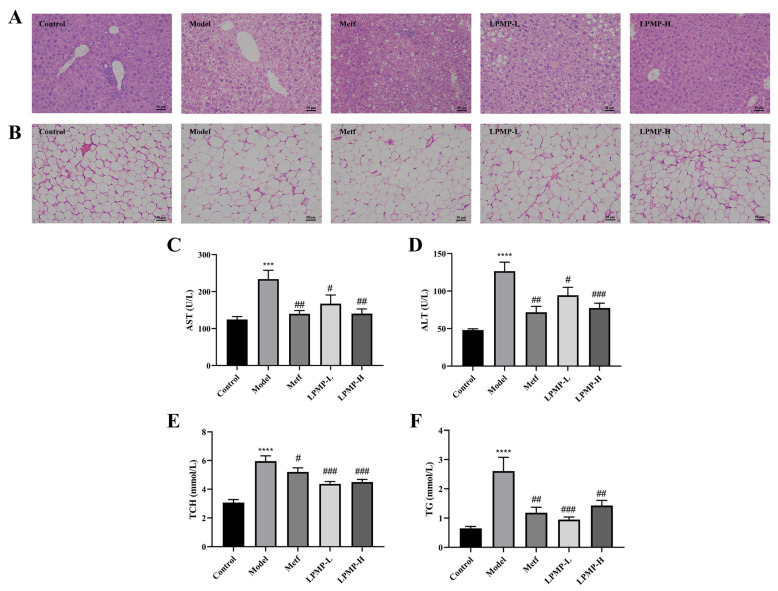
Figure 9.
Effect of LPMP on the pathological changes of liver (A) and adipose (B) tissue. H&E staining was conducted to observe the pathological changes under 200× magnification. Control: 5 mL/kg/day water; Model: 5 mL/kg/day water; Metf: 225 mg/kg/day metformin; LPMP-L: 20 mg/kg/day LPMP; LPMP-H: 100 mg/kg/day of LPMP. Serum levels of AST (C), ALT (D), TCH (E), and TG (F) in diabetic mice. The results shown are means ± SEM (n = 8). **** p < 0.001, *** p < 0.001 versus control group; # p < 0.05, ## p < 0.01, ### p < 0.001 versus model group.

