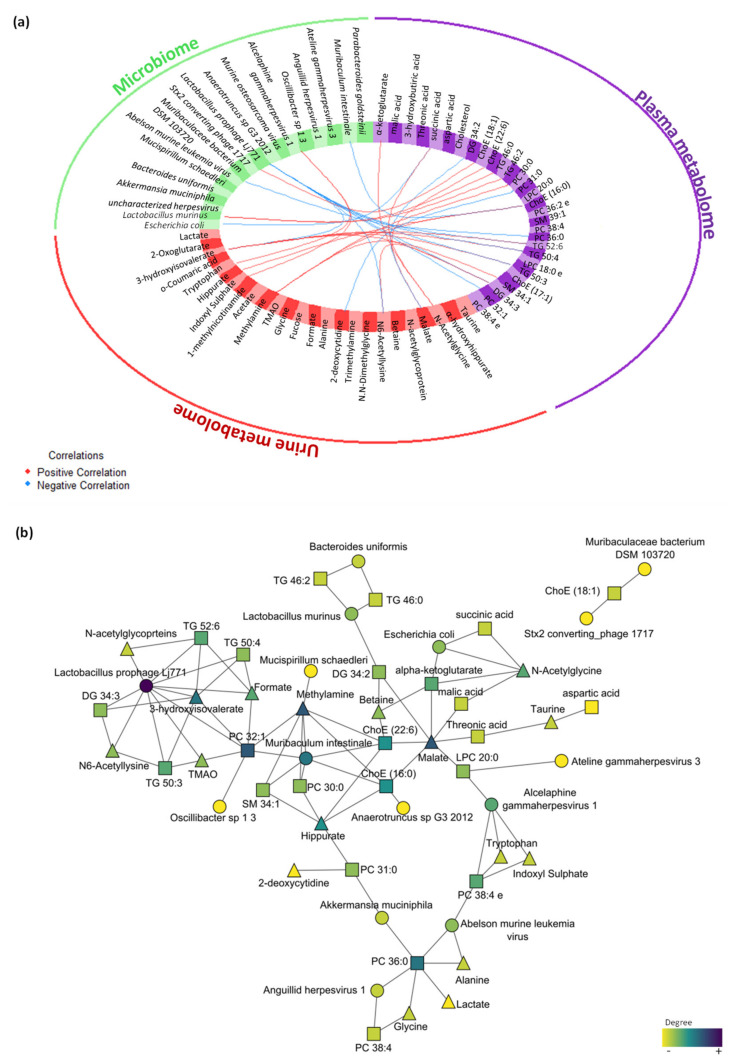
Figure 6.
Multi-omics integration of plasma metabolome, urine metabolome and microbiome in the early stress stage. (a) Circos plot output from DIABLO. Each quadrant indicates the type of features: plasma metabolites (purple), urine metabolites (red), bacteria species (green) and virus species (orange); lines indicate measure of association (correlation), either positive or negative. (b) Further visualization of the network from DIABLO using Cytoscape. The shape of the features indicates the type of feature: plasma metabolites (square), urine metabolites (triangle) and metagenomics (circle). The colour indicates the degree of each feature in the network (i.e., nodes with more connections). Abbreviations: DG, diacylglycerol; ChoE, cholesterol ester; TG, triglyceride; PC, phosphatidylcholine; SM, sphingomyelin; LPC, lysophospholipid.

