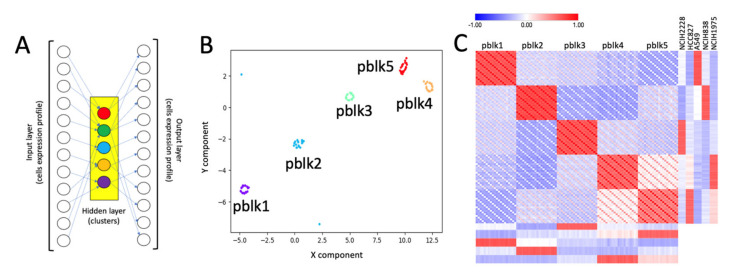
Figure 1.
Pseudo-bulk clusters generated by SCA. (A) Structure of the SCA used to generate pseudo-bulk RNAseq data from each sub-population (cluster), depicted by clustering of RNA-5c dataset, Figure 2A. The pseudo-bulks are generated using the hidden layer data, repeating multiple times the SCA runs. (B) t-Sne output of 20 runs of SCA. It is notable that multiple runs of SCA produce pseudo-bulks, which are clustering around the centroid of each cells’ sub-population, i.e., the circular/oval structures observable in the tSne plot for the 20 runs of SCA. (C) Row-mean centered CPM (counts per million of reads) expression for pseudo-bulks (B) is combined with row-mean centered TPM (transcripts per million of reads) expression of the bulk RNAseq for H2228, H1975, A549, H838 and HCC827 cell lines, retrieved from the CCLE repository [17]. The plot shows the Pearson correlation matrix of the two datasets. It is notable that pseudo bulk expression correlates with the RNAseq bulk experiment for the five cell lines present in the RNA-5c experiment.

