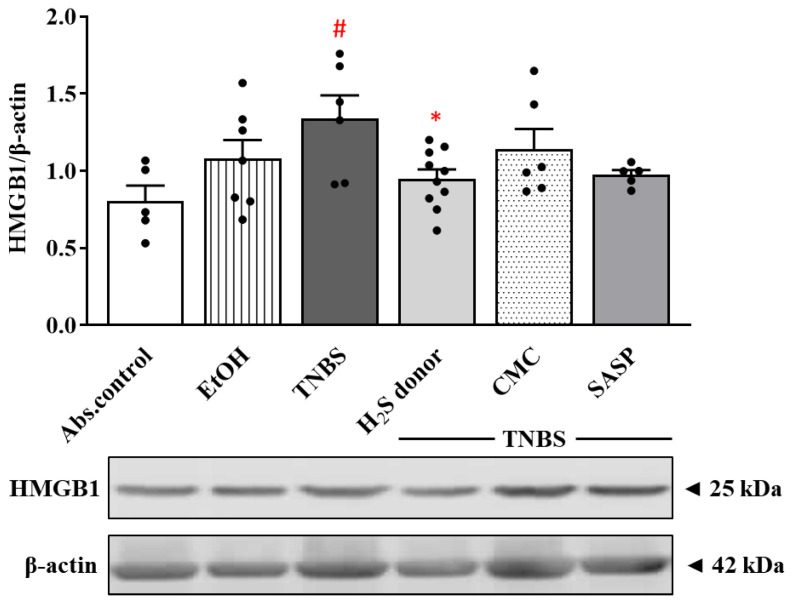
Figure 5.
Alterations of the expression of HMGB1 in the treated groups. Absolute control (no treatment); EtOH (50% ethanol, the solvent of TNBS); TNBS (2,4,6-trinitrobenzenesulfonic acid enema); H2S donor (TNBS + 18.75 µM/kg/day Lawesson’s reagent); CMC (TNBS + 0.5% carboxymethylcellulose, the vehicle of Lawesson’s reagent); SASP (TNBS + 50 mg/kg/day sulfasalazine, as a positive control). Results are presented as mean + S.E.M.; n = 5–10/group; one-way ANOVA, Holm–Sidak post hoc test, # p < 0.05 absolute control vs. TNBS; * p < 0.05 TNBS vs. TNBS + H2S donor treatment.

