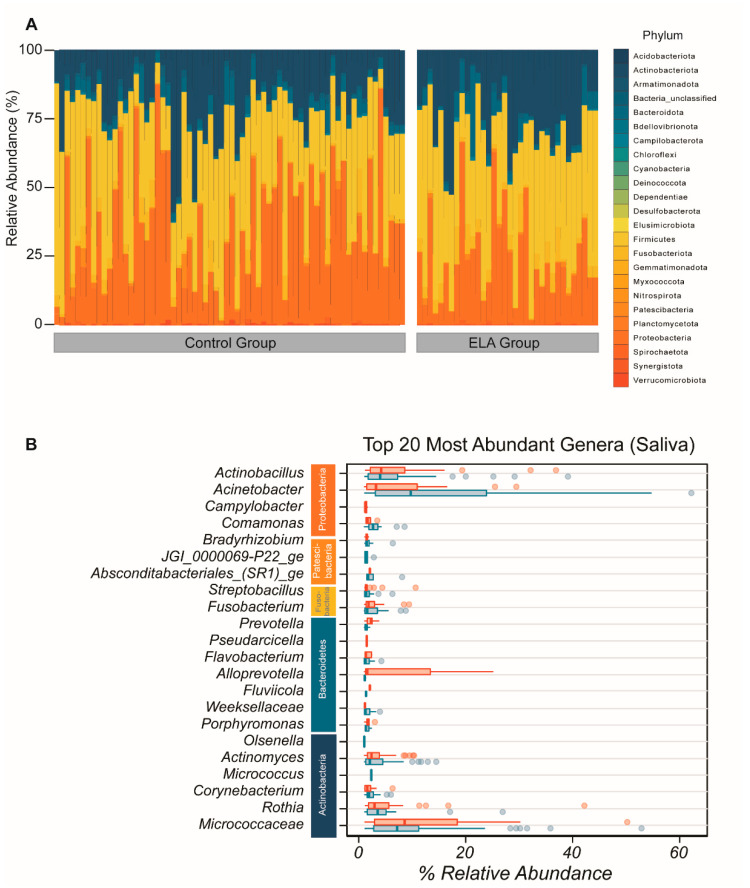
Figure 1.
Overall composition of salivary bacterial community. (A) Overall microbial composition displayed in stacked area bar plot with the percentage relative abundance of all phyla found in each participant in both study arms. (B) Top 20 most abundant genera by mean abundance arranged graphically by phyla. Vertical line = mean; rectangle = 1st to 3rd quartile; horizontal lines = 2.5th to 97.5th percentile. Outliers are indicated as individual data points. Blue, control group; red, ELA group.

