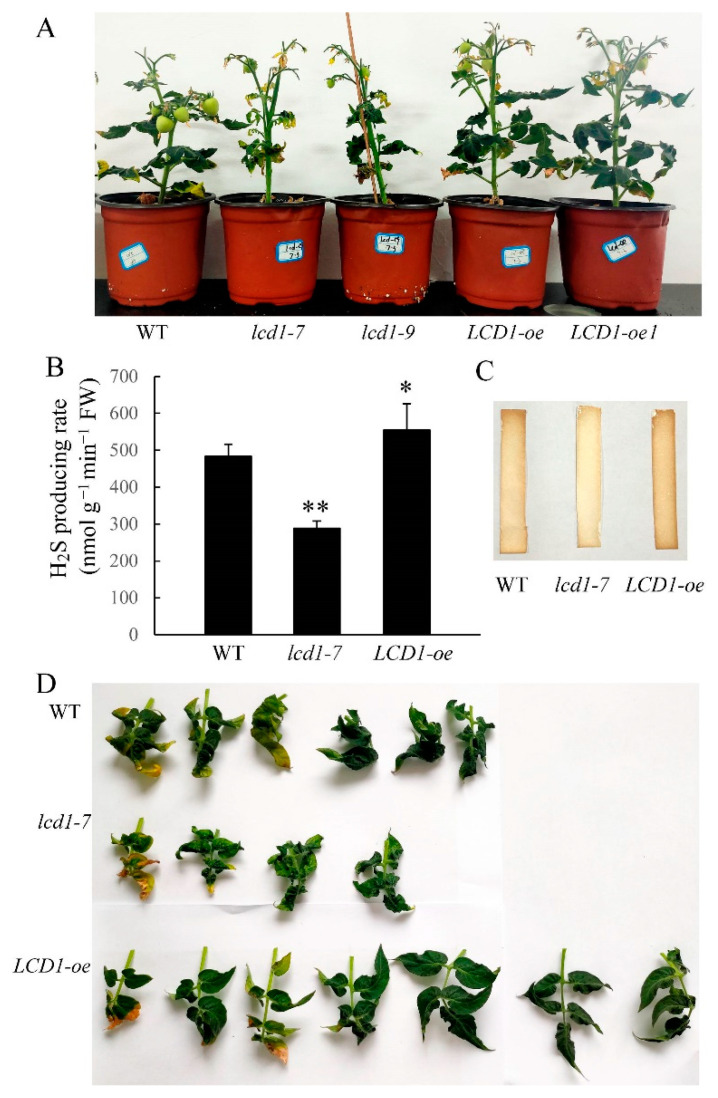
Figure 1.
Phenotypic characterization of lcd1 mutants and LCD-oe (over-expression) tomatoes. (A) Phenotype of 10-week-old wild-type (WT), lcd1-7, lcd1-9, LCD1-oe, and LCD1-oe1 plants. (B) H2S producing rate in the mature leaves from wild type, lcd1, and LCD1-oe lines of 10 weeks growth. (C) H2S production from the mature leaves of 10-week-old wild type, lcd1, and LCD1-oe lines detected by lead acetate H2S detection strips (Sigma-Aldrich). (D) The leaves of different tomato lines in (A) were detached and photographed. Data are means of three biological replicates ± standard deviation (SD). The symbols * and ** stand for p < 0.05 and p < 0.01 as determined by the Student’s t-test, respectively.

