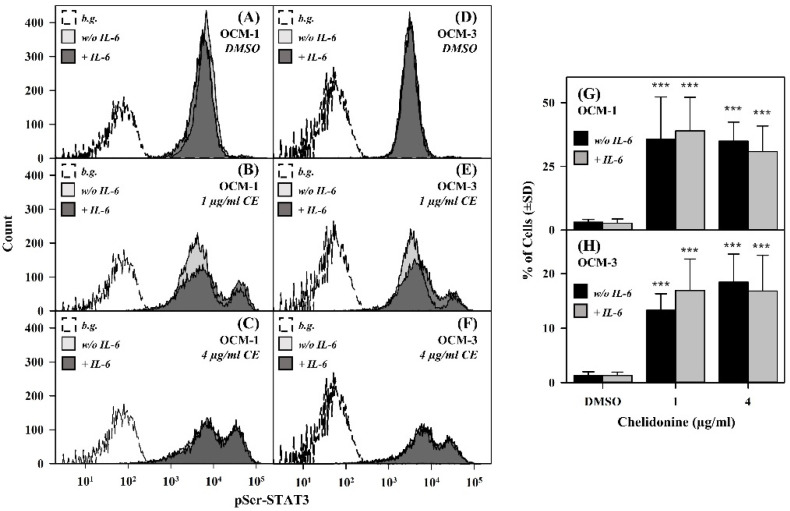
Figure 2.
Serine phosphorylation of STAT3 is enhanced by chelidonine in a significant portion of OCM-1 and OCM-3 cells. (A–F) Representative flow cytometric intensity histograms demonstrate cell-by-cell distribution of pSer-STAT3 levels in DMSO- and chelidonine-treated cells. The thick black line and the filled grey histograms belong to IL-6-stimulated and unstimulated cells, respectively, whereas the dashed line histograms represent unlabeled cells (background). (G,H) Bar charts demonstrate the fraction of cells with increased levels of pSer-STAT3 for DMSO- and chelidonine-treated OCM-1 and OCM-3 cells. Grey and black bars represent IL-6-stimulated and unstimulated cells, respectively. Percentages are expressed as the mean ± SD values of at least three independent experiments, p-value < 0.001 (***). Cells treated with chelidonine (1 or 4 µg/mL) or DMSO (vehicle control) for 24 h were incubated either in the presence of IL-6 (20 ng/mL) or alone for 30 min at 37 °C. Cells were then stained with PE-conjugated mAbs specific for pS727-STAT3 and analyzed by flow cytometry (n = 10,000 cells/sample). (b.g.: background, CE: chelidonine, pSer-STAT3: STAT3 phosphorylated on the serine 727 residue, w/o: without).

