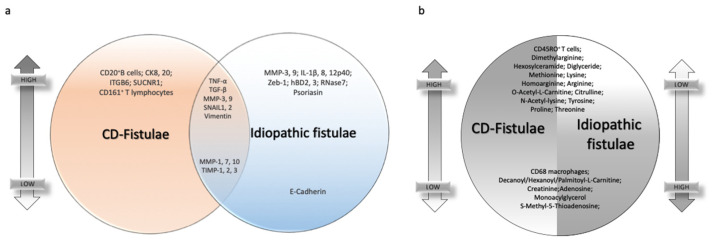
Figure 2.
Common and dissimilar signatures between CD- and idiopathic fistulae. (a) Venn diagram highlighting individual or common markers expression in CD-related fistulae and idiopathic ones, on the top if they are upregulated, on the bottom if they are downregulated. (b) Differential markers expression in CD-related fistulae versus idiopathic fistulae. On the right of the circle, the expression is lower on the top of the graph and higher on the bottom. Vice versa, on the left part of the circle, the expression of the same markers is higher on the top and lower on the bottom.

