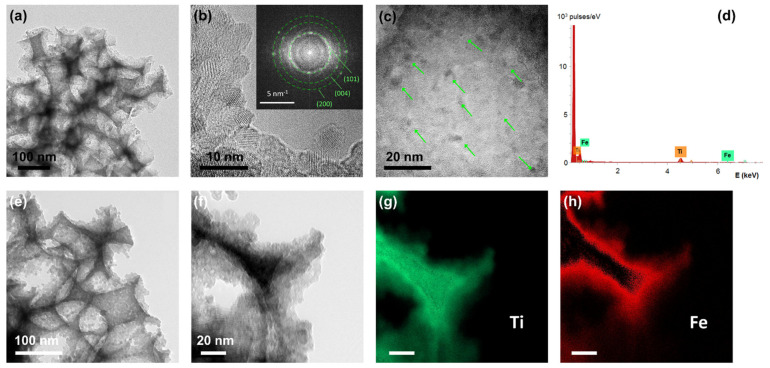
Figure 2.
(a–c) TEM images for FeOx-PC260-1st at different magnifications. The inset in (b) shows the corresponding FFT pattern (d) Local EDX spectrum corresponding to the image (b). (e,f) TEM images for FeOx-PC260-3rd at different magnifications and the (g) Ti and (h) Fe EFTEM elemental maps corresponding to (f).

