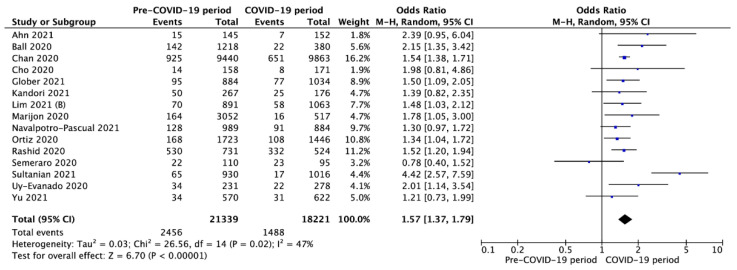
Figure 6.
Forest plot of survival to hospital discharge in pre- vs. intra-COVID-19 periods. The center of each square represents the weighted odds ratios for individual trials, and the corresponding horizontal line stands for a 95% confidence interval. The diamonds represent pooled results. Legend: CI = confidence interval; OD = odds ratio.

