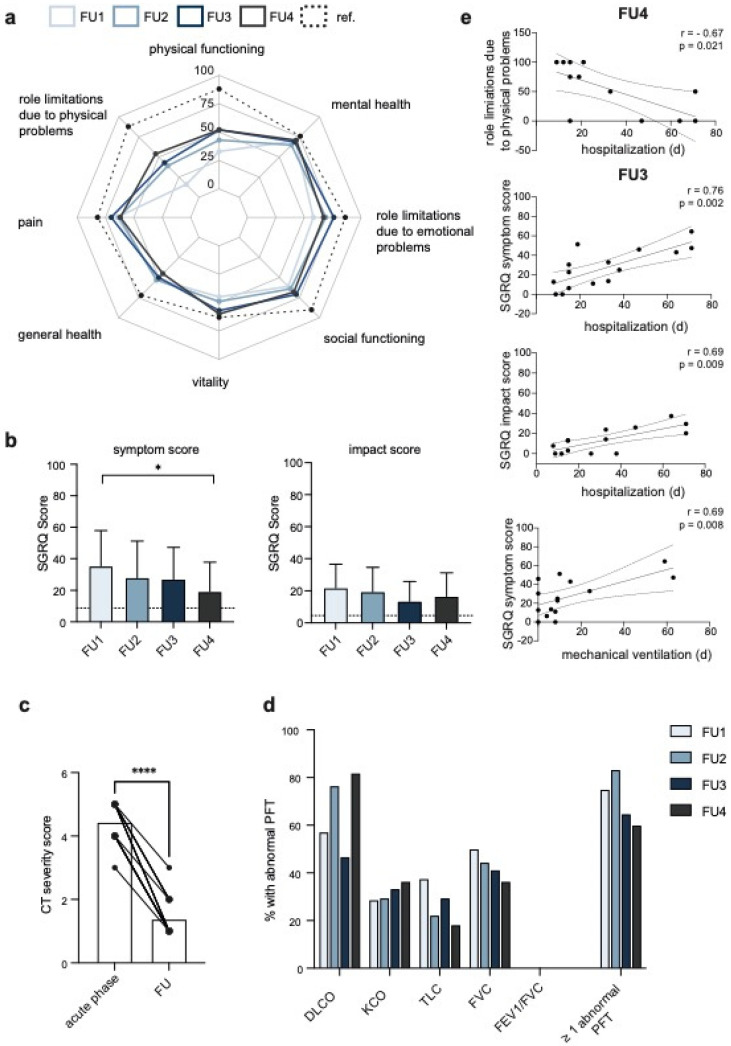
Figure 1.
Follow-up assessments of HrQoL, pulmonary function and radiological CT severity scores in critical COVID-19 survivors. (a) The radar plot shows the SF-36 scores of eight dimensions for all FUs and reference values (healthy men aged 45–54) in dashed lines. A score of 100 represents the best subjective health state. (b) Boxplots show the mean (±SD) SGRQ symptom (left panel) and impact score (right panel) of all follow-up assessments (FU). The dashed lines indicate mean reference scores for the age group 50–59. (c) The CT severity scores from chest CTs performed at the time of admission (acute phase) and during follow-up (119 ± 15.3 days upon discharge) are plotted, and the lines connect the scores of each individual patient. (d) The percentage of patients with abnormal PFTs (≤80% of the predicted value) is presented. (e) The scatter plots show the Spearman correlations with a 95% confidence interval for the FU3 or FU4. The Spearman r and p-values are annotated. See Figure S3 for all FUs. Significance was tested by the one-way-ANOVA with Dunnett’s multiple comparison test (b) and by the Wilcoxon matched-pairs signed rank test (c), and is indicated by asterisk (* = p < 0.05; **** = p < 0.0001). Non-significant levels are not labelled. CT, computed tomography; d, days; DLCO, lung diffusion capacity for CO; FEV1, forced expiratory volume at the first second of maximal expiration; FVC, forced vital capacity; FU, follow-up appointment; KCO, carbon monoxide transfer rate; PFT, pulmonary function test; ref., reference; SGRQ, St. George’s Respiratory Questionnaire; TLC, total lung capacity.

