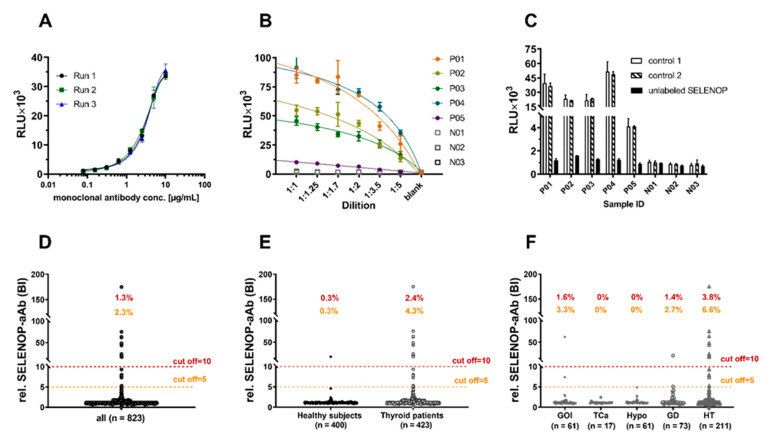
Figure 1.
Characterization of the novel autoantibody assay and prevalence of SELENOP-aAb in thyroid patients. (A) The SELENOP-aAb assay is characterized by linear response to a SELENOP-specific antibody in gradual dilutions. Signal intensity (RLU—relative light units) correlated to antibody concentration over a range from 0.078–5.0 µg/mL, yielding an R squared by sigmoidal 4 PL curve fitting above 0.99. (B) High signal intensities (RLU) decreased gradually with linear dilutions of SELENOP-aAb-positive (P01–P05) samples, but not of negative (N01–N03) samples. (C) Suppression of SELENOP-aAb signals by competition with unlabeled SELENOP (1 mg/mL) using equal volumes of sample and unlabeled SELENOP without (control 1) or with BSA (1 mg/mL; control 2). (D) Analysis of the full cohort of samples (n = 823) yielded a skewed distribution of SELENOP-aAb signals; the thresholds of BI = 5.0 or BI = 10.0 are indicated by dashed lines. (E) SELENOP-aAb-positive samples were more prevalent in thyroid patients than in controls (BI > 5; 4.3 vs. 0.3%, or BI > 10; 2.4 vs. 0.3%). (F) Among patients, SELENOP-aAb were most prevalent in Hashimoto’s thyroiditis (HT). GOI—goitre; TCa—thyroid carcinoma; Hypo—hypothyroidism; GD—Graves’ disease.

