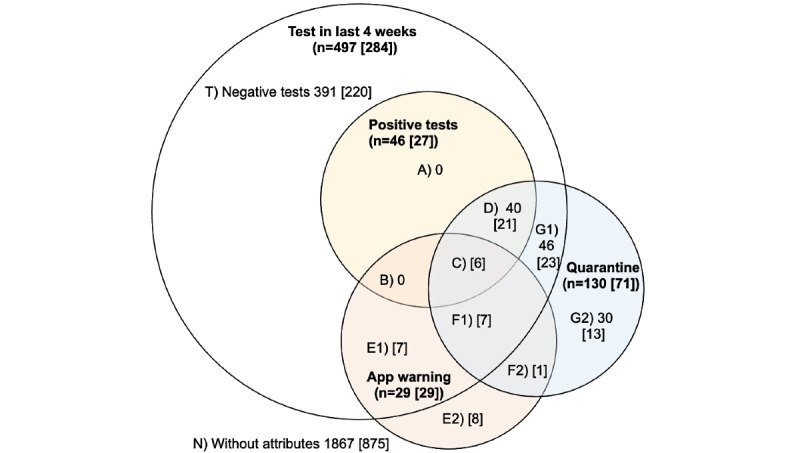
Figure 3.

Venn diagram representation of mitigative actions taken by 4 survey subpopulations (in bold) after follow-up: (1) respondents who were tested for SARS-CoV-2 in the past 4 weeks (white circle), (2) respondents who tested positive for SARS-CoV-2 (yellow circle), (3) respondents who received exposure notifications (red circle), and (4) respondents who were placed in quarantine by Swiss cantonal health services or by a physician (blue circle). Sample sizes of specific segments are indicated in the diagram, with the values in [square brackets] reflecting the number of DPT app users in a given segment. Each (non)overlap represents a subpopulation of the survey respondents.
