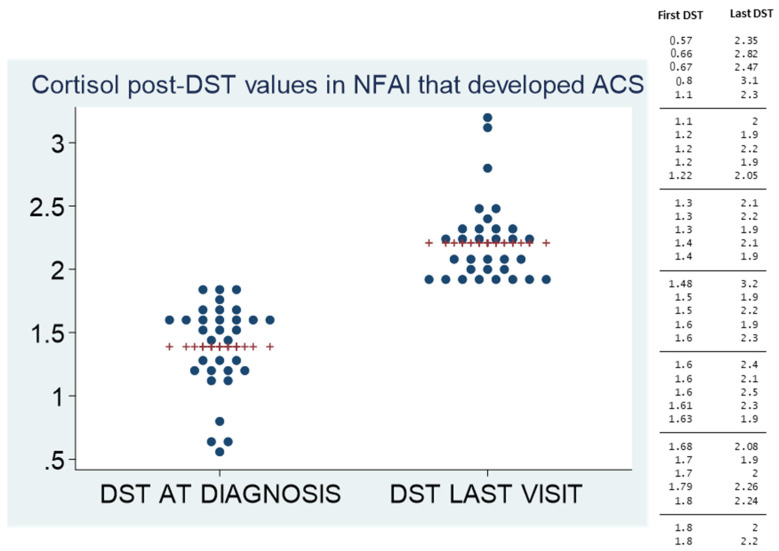
Figure 2.
Evolution of the cortisol post-DST at diagnosis and at the last visit in patients who developed ACS. The values of cortisol post-DST at diagnosis and in the last visit in patients with NFAIs who developed ACS are described in the table and figure, including the mean value (red marker) in each moment.

