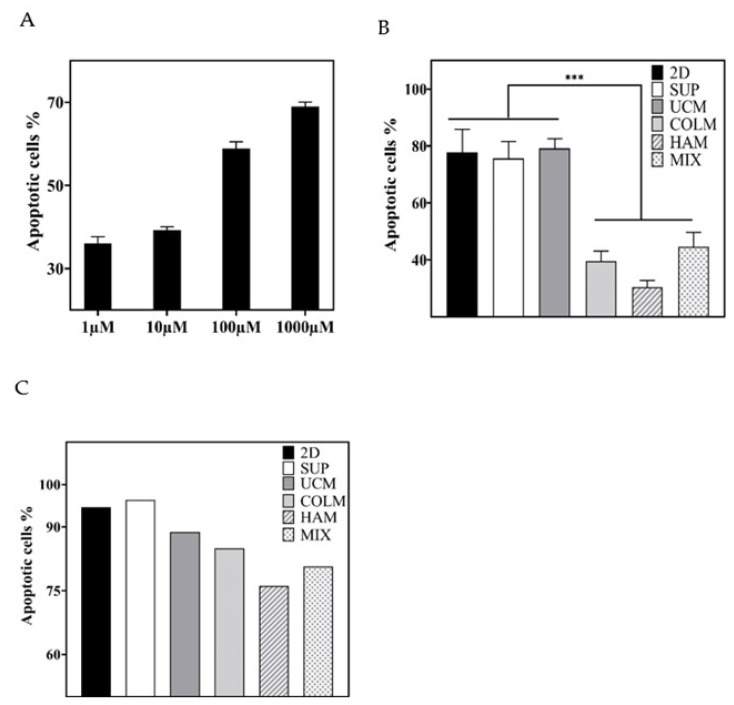
Figure 5.
Percentage of apoptotic cells after exposition to DEX (A,B) and BRZ (C). 2D culture at varying DEX dose (A); influence of the presence of hyaluronic acid or collagen on the development of drug resistance (B,C). The level of statistical significance is shown as (***) p-value ≤ 0.001. 2D, conventional 2D control culture; SUP, suspension control; UCM, control with uncoated alginate microspheres; HAM, microspheres with a last layer of hyaluronic acid; COLM, microspheres with a last layer of collagen; MIX, mixture of 50% HAM and 50% COLM microspheres.

