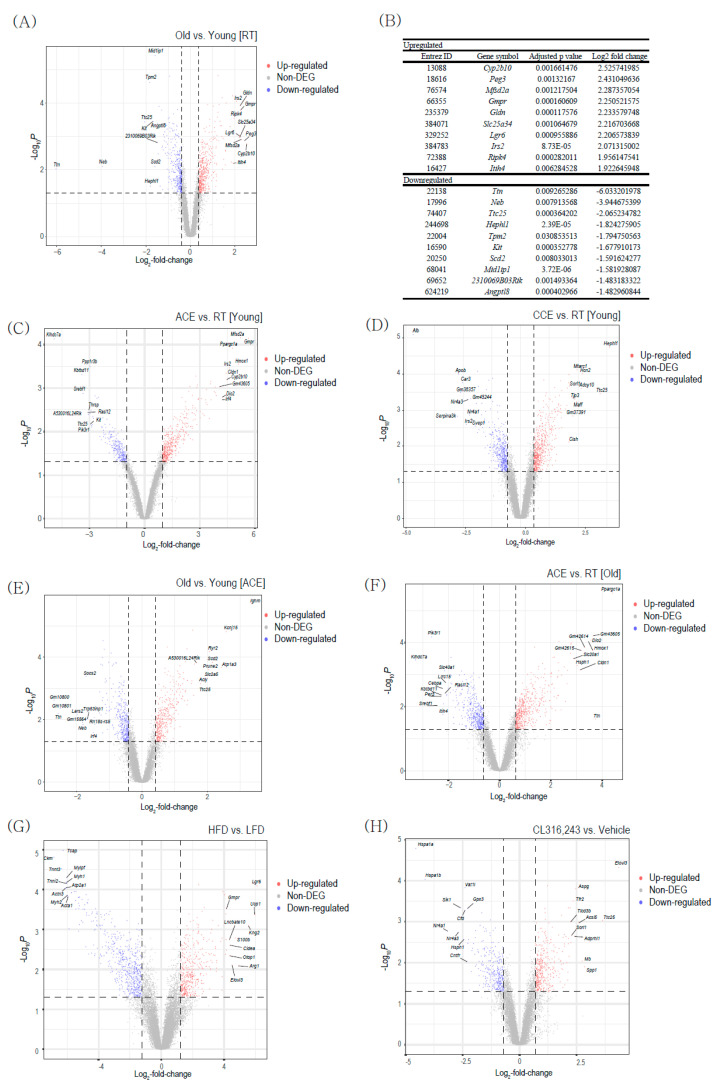
Figure 1.
Differentially expressed genes (DEGs) between young and old brown adipose tissues (BAT). (A) Volcano plot of the DEGs between old vs. young BAT (GSE135391). (B) The list of top 10 upregulated and downregulated DEGs between old vs. young BAT. (C) Volcano plot of the DEGs between acute severe cold exposure (ACE) vs. room temperature (RT) in young BAT (GSE135391). (D) Volcano plot of the DEGs between chronic mild cold exposure (ACE) vs. room temperature (RT) in young BAT (GSE172021). (E) Volcano plot of the DEGs between old vs. young BAT upon ACE (GSE135391). (F) Volcano plot of the DEGs between ACE vs. RT in old BAT (GSE135391). (G) Volcano plot of the DEGs between high-fat diet (HFD) vs. low-fat diet (LFD) in young BAT (GSE112740). (H) Volcano plot of the DEGs between CL316243 treatment vs. vehicle treatment in young BAT (GSE98132).

