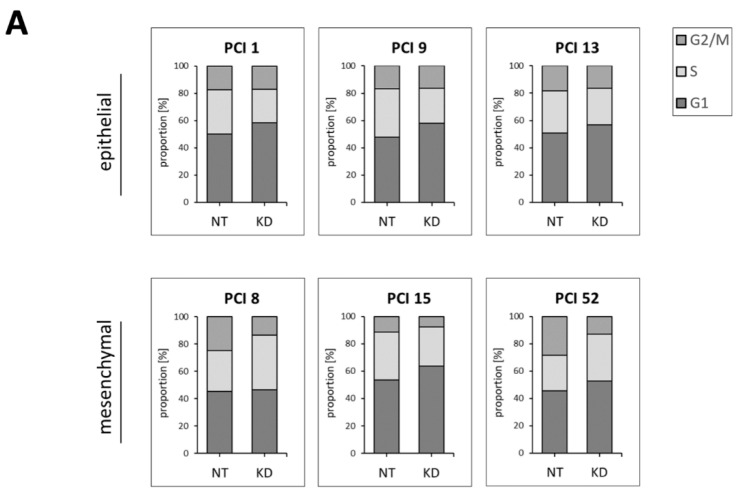
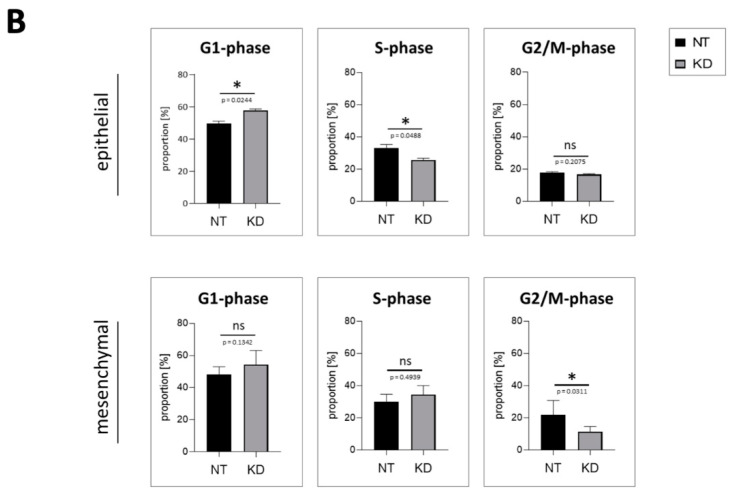
Figure 6.
Proportion of specific cell cycle phases after PD-L1 knockdown. In the six different HNSCC cell lines (i.e., PCI 1, 9, 13, 8, 15, and 52), PD-L1 levels were reduced after siRNA knockdown (KD). Transfection with non-targeting siRNA (NT) served as the control. (A) Stacked bar charts show the percentage of cells in the G1, S, or G2/M phase. All three phases together sum up to 100%. (B) For statistical analysis, PD-L1 KD samples of the three epithelial and three mesenchymal cell lines were compared with their respective NT controls, using ratio paired t-tests (ns = p ≥ 0.05; * = p < 0.05). n = 3. KD efficiency is shown in Supplementary Materials Figure S3. The effect on the proliferation rate of epithelial HNSCCs is shown in Supplementary Materials Figure S4, while the effect on mesenchymal HNSCCs is shown in Schulz et al. Figure 5 [25].


