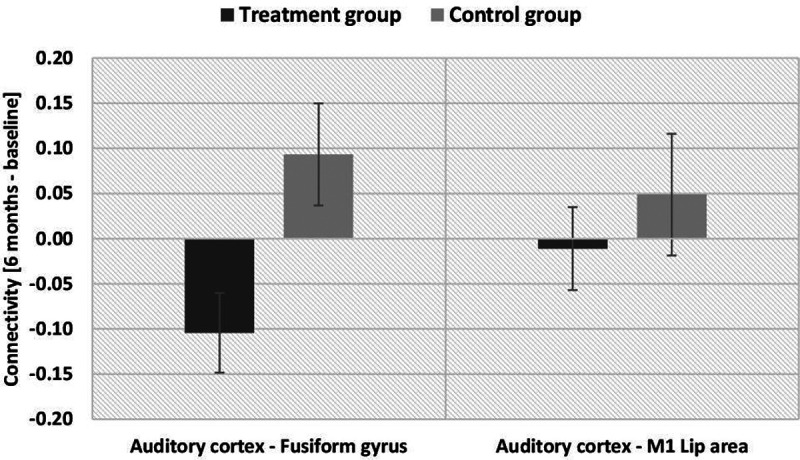
Figure 6.

Change in resting-state functional connectivity between measurements at baseline and after six months for the two groups (ROI-to-ROI analysis). Negative values refer to a decrease in connectivity between the respective regions after six months, positive values refer to an increase in connectivity after six months; ROIs were positioned in (1) left and right auditory cortex, (2) left and right fusiform gyrus, (3) left M1 lip area (mean values with standard error of the mean).
