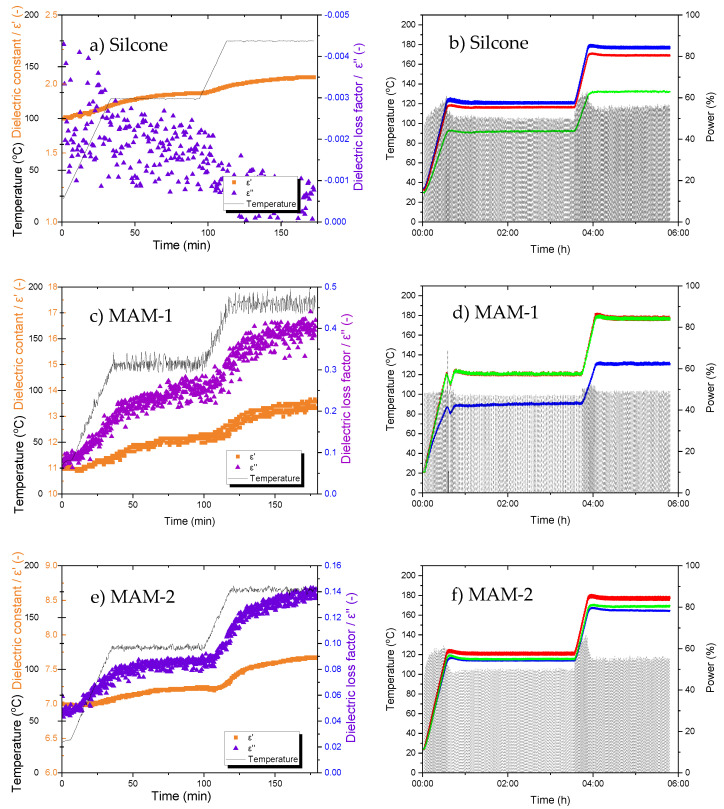
Figure 3.
Dielectric properties and temperature-time-power graphs of (a,b) silicone, (c,d) MAM-1, and (e,f) MAM-2, respectively. The temperature-time-power graphs include the setpoint temperature (black solid), FOT-1 (blue), FOT-2 (red), FOT-3 (green), and power (black dash), where trials were conducted on the microwave test bed.

