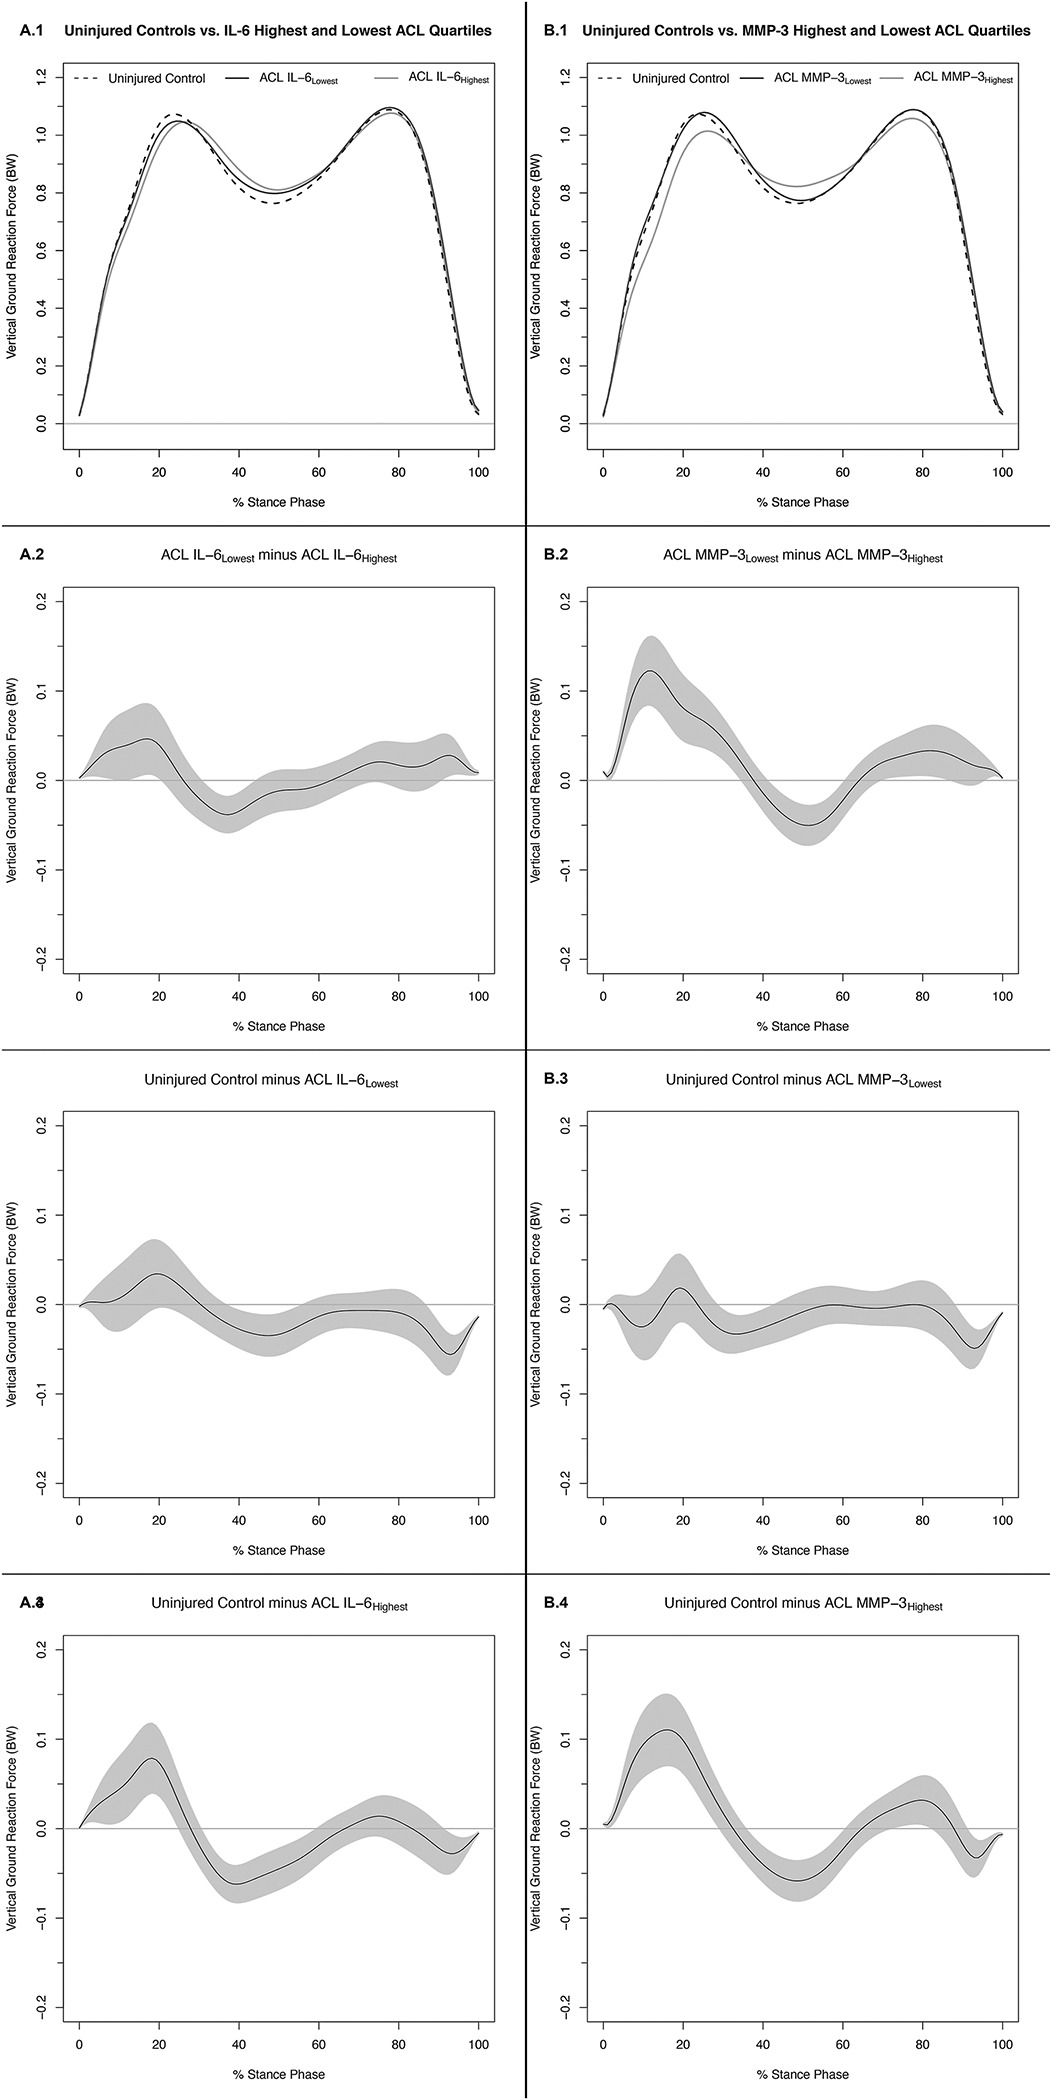
Figure 1. Vertical Ground Reaction Forces (.1) and Mean Difference Curves (.2-.4) of Uninjured Controls and Highest and Lowest IL-6 (A) and MMP-3 (B) ACL Cohort Quartiles.

Figures 1A.1 and 1B.1 depict mean ensemble waveforms plotted over the stance phase of walking, for mean vertical ground reaction force (vGRF), normalized to body weight (BW) for the Uninjured Controls and Highest and Lowest IL-6 (A) and MMP-3 (B) ACL Cohort Quartiles. Figures 1A.2–4 and 1B.2–4 depict corresponding pairwise comparison functions, and associated 95% confidence intervals (grey bands), indicating the mean differences between the Uninjured Controls and Lowest (.3), Uninjured Controls and Highest (.4), and Lowest and Highest (.2) IL-6 (A) and MMP-3 (B) Quartiles. Differences between groups existed whenever the 95% confidence intervals did not overlap zero.
