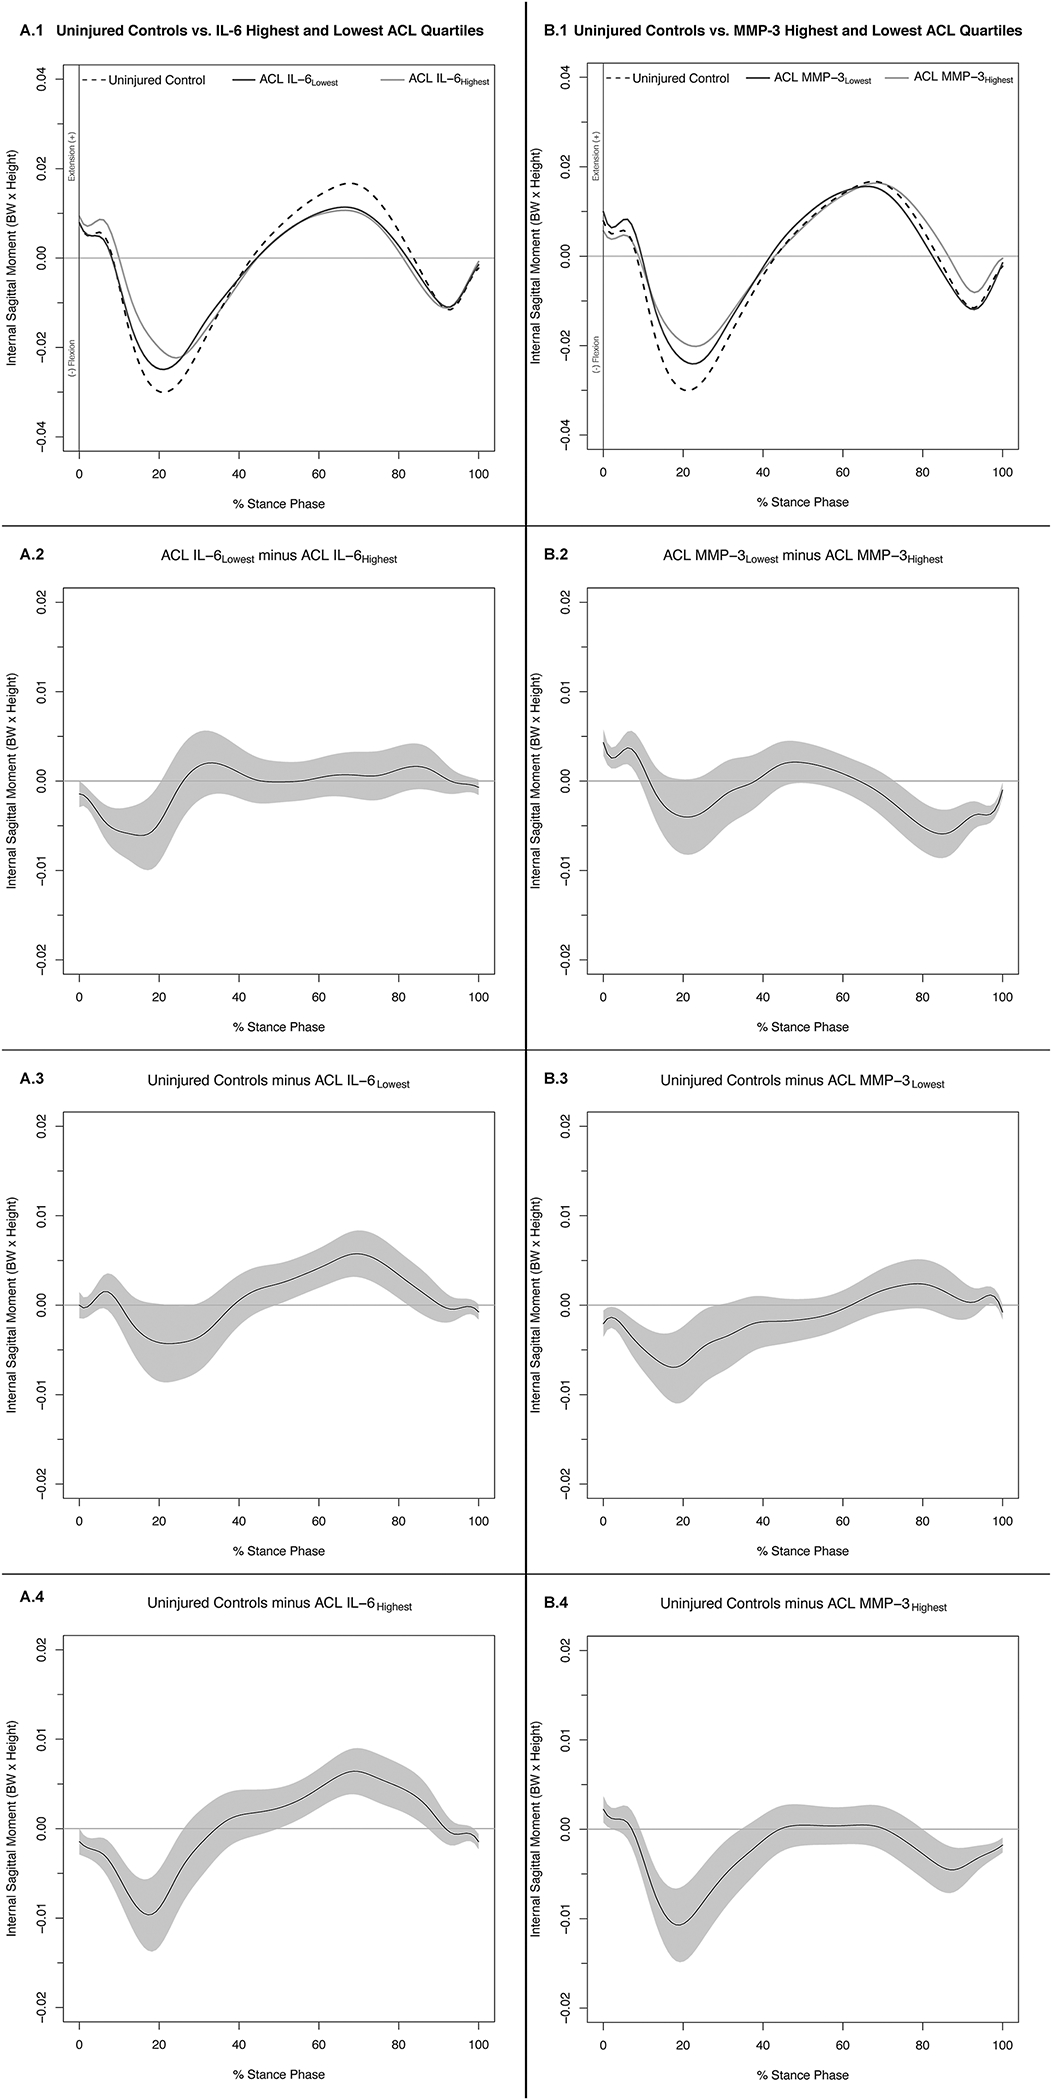
Figure 3. Internal Knee Extension Moments (.1) and Mean Difference Curves (.2-.4) of Uninjured Controls and Highest and Lowest IL-6 (A) and MMP-3 (B) ACL Cohort Quartiles.

Figures 1A.1 and 1B.1 depict mean ensemble waveforms plotted over the stance phase of walking, for mean internal knee extension moments normalized to body weight (BW × Height), for the Uninjured Controls and Highest and Lowest IL-6 (A) and MMP-3 (B) ACL Cohort Quartiles. Figures 1A.2–4 and 1B.2–4 depict corresponding pairwise comparison functions, and associated 95% confidence intervals (grey bands), indicating the mean differences between the Uninjured Controls and Lowest (.3), Uninjured Controls and Highest (.4), and Lowest and Highest (.2) IL-6 (A) and MMP-3 (B) Quartiles. Differences between groups existed whenever the 95% confidence intervals did not overlap zero.
