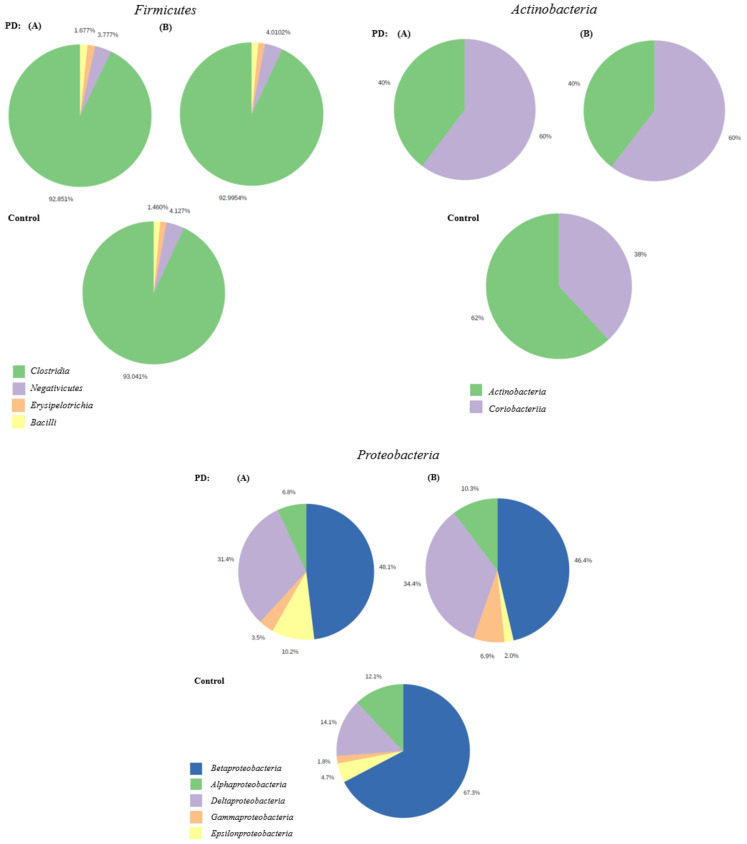
Figure 4.
Pie charts presenting the comparative abundance profiles across two groups PD and control at class level in the phyla Firmicutes, Actinobacteria, and Proteobacteria. Pie charts with (A) represent the study group diagnosed with PD and other diseases (such as hypertension and diabetes), the pie charts with (B) represent the study group diagnosed with PD and without other diseases.

