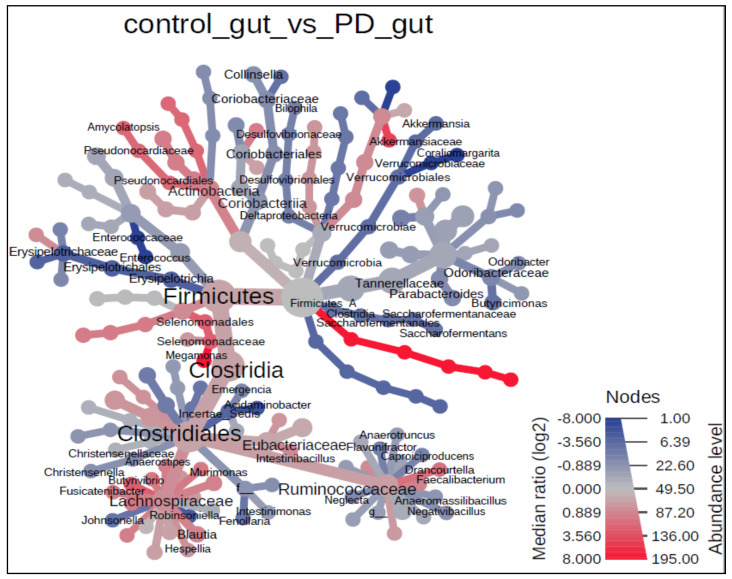
Figure 8.
The heat tree analysis, showing the taxonomic differences of fecal microbiota between PD and healthy controls. Only significant taxon names were labeled on the heat tree. Statistical significance was calculated using the non-parametric Wilcoxon Rank Sum test with 0.05 Wilcoxon p-value cut-off.

