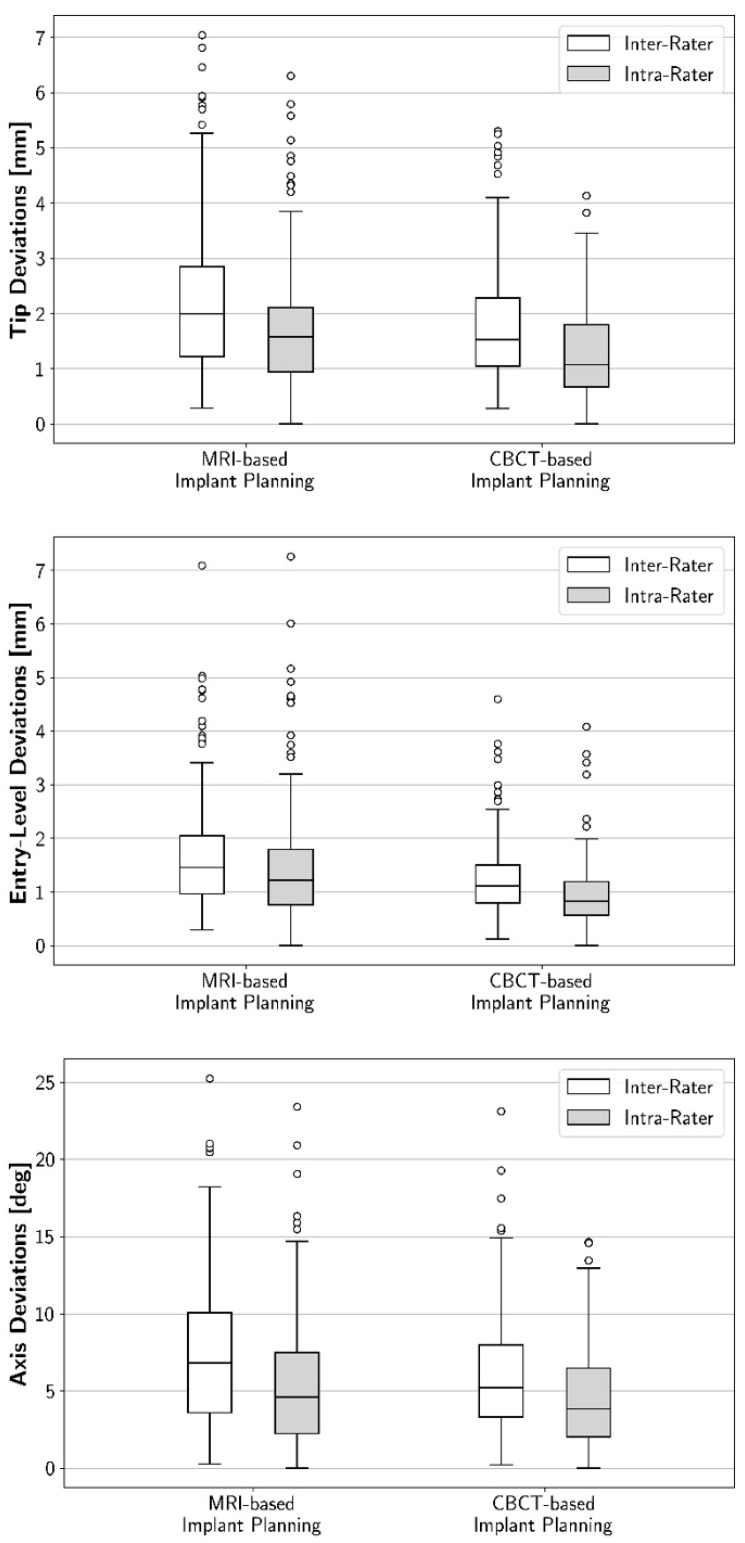
Figure 2.
Boxplot diagrams illustrating, for MRI and CBCT, intra-rater and inter-rater deviations for implant tip, entry-level, and axis. For all three areas of the implant, intra-rater reproducibility and inter-rater reproducibility were higher for CBCT-based implant plans than for MRI-based ones. Outliers are depicted as hollow circles.

