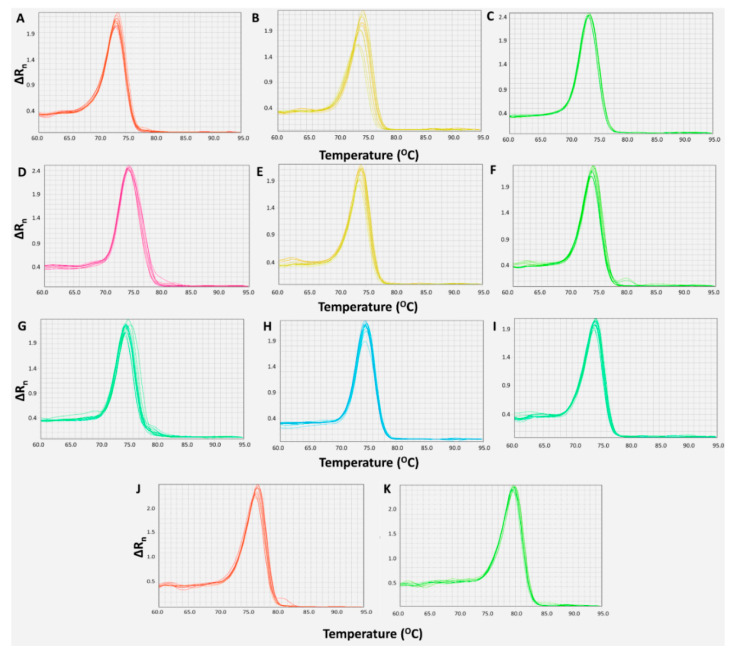
Figure 1.
Melting curves of miR-15a-5p (A), miR-16-5p (B), miR-21-5p (C), miR-25-3p (D), miR-125b-5p (E), miR-155-5p (F), miR-221-3p (G), miR-222-3p (H), miR-223-3p (I), SNORD43 (J), and SNORD48 (K), generated after their amplification under the optimized conditions of the real-time quantitative PCR (qPCR) assays. The graphs were built by plotting ΔRn, which represents the difference in the fluorescence from the baseline, against temperature.

