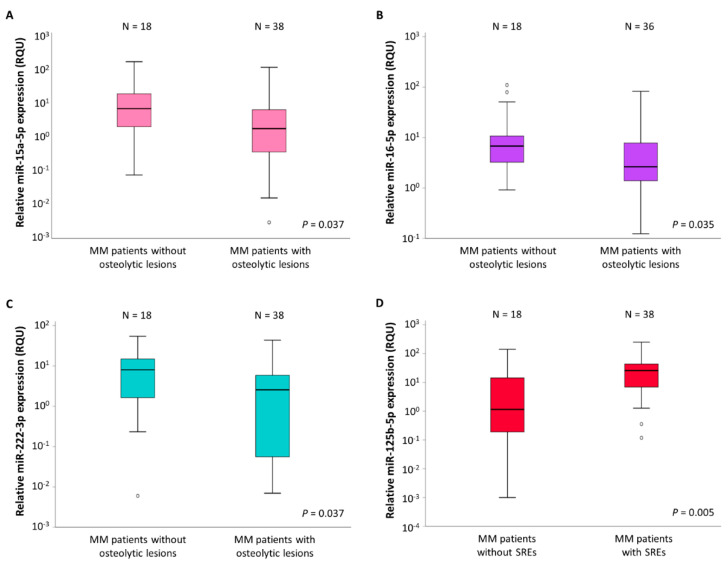
Figure 3.
Boxplots showing the relative expression of miR-15a-5p (A), miR-16-5p (B), and miR-222-3p (C) in CD138+ plasma cells of multiple myeloma (MM) patients without and with osteolytic lesions. (D) Boxplot showing the relative expression of miR-125b-5p in CD138+ plasma cells of MM patients without and with skeletal-related events (SREs). The bold line inside each box represents the median value, while the lower and upper borders of the box represent the 25th (Q1) and 75th (Q3) percentiles, respectively; the area within the box represents the interquartile range (IQR). The lower and upper whiskers show values equal to and , respectively. The circles outside boxes indicate outliers. The scale of the vertical axis is logarithmic.

