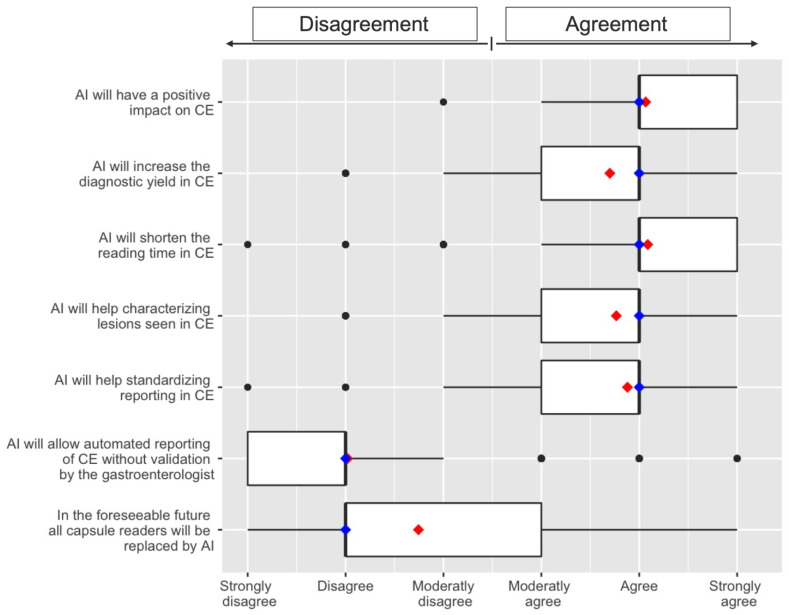
Figure 4.
Perceptions of AI toward capsule endoscopy. Box plots show the distribution of responses using a Likert scale ranging from 1 to 6 (strongly disagree to strongly agree). The mean value is plotted with a red dot. The vertical blue bar represents the median value; 25th and 75th percentiles are set as box limits.

