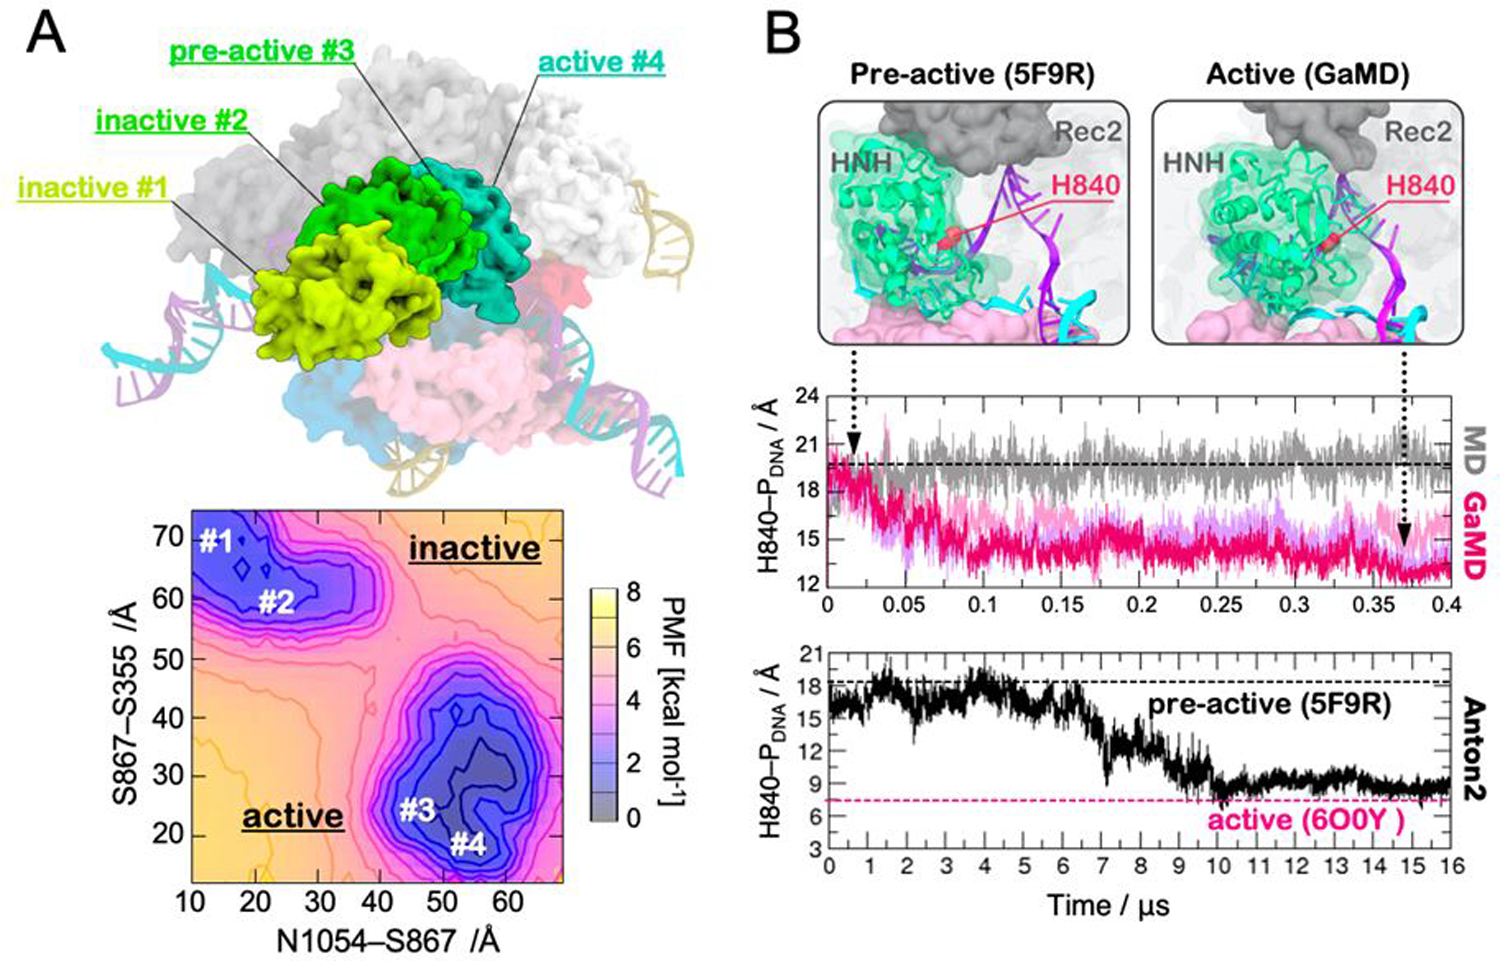
Figure 3.

(A) Conformations of the HNH domain (green) in its inactive (#1, #2), pre-active (#3) and active (#4) states, as experimentally determined through single-molecule FRET and structural approaches (top panel). The free energy landscape (i.e., Potential of Mean Force, PMF) associated to the conformational changes of the HNH domain from its inactive to active states is shown in the bottom panel. The minima correspond to the four states experimentally found (top). The PMF was computed along the S867-S355 and N1054-S867 FRET distances. Adapted with permission from Palermo et al. (2017). https://www.pnas.org/content/114/28/7260. Copyright 2017 National Academy of Sciences. (B) Conformational change of the HNH domain from its pre-active conformation (captured in the PDB ID: 5F9R, left) to the active state identified through GaMD (right). The active state displays the catalytic residue H983 close to the DNA target strand (TS). The distance between the catalytic H840 and the scissile phosphate (H840–PDNA) has been computed along ~400 ns GaMD (central panel) and ~16 μs of continuous MD using the specialized supercomputer Anton-2 (bottom panel). The black dashed line indicates the pre-active conformation (PDB ID: 5F9R) used as a starting point for MD simulations, while the magenta dashed line indicates the active conformation more recently captured through cryo-EM (PDB ID: 6O0Y). Reprinted with permission from Palermo et al. (2018). Copyright 2018 Cambridge University Press. https://doi.org/10.1017/S0033583518000070.
