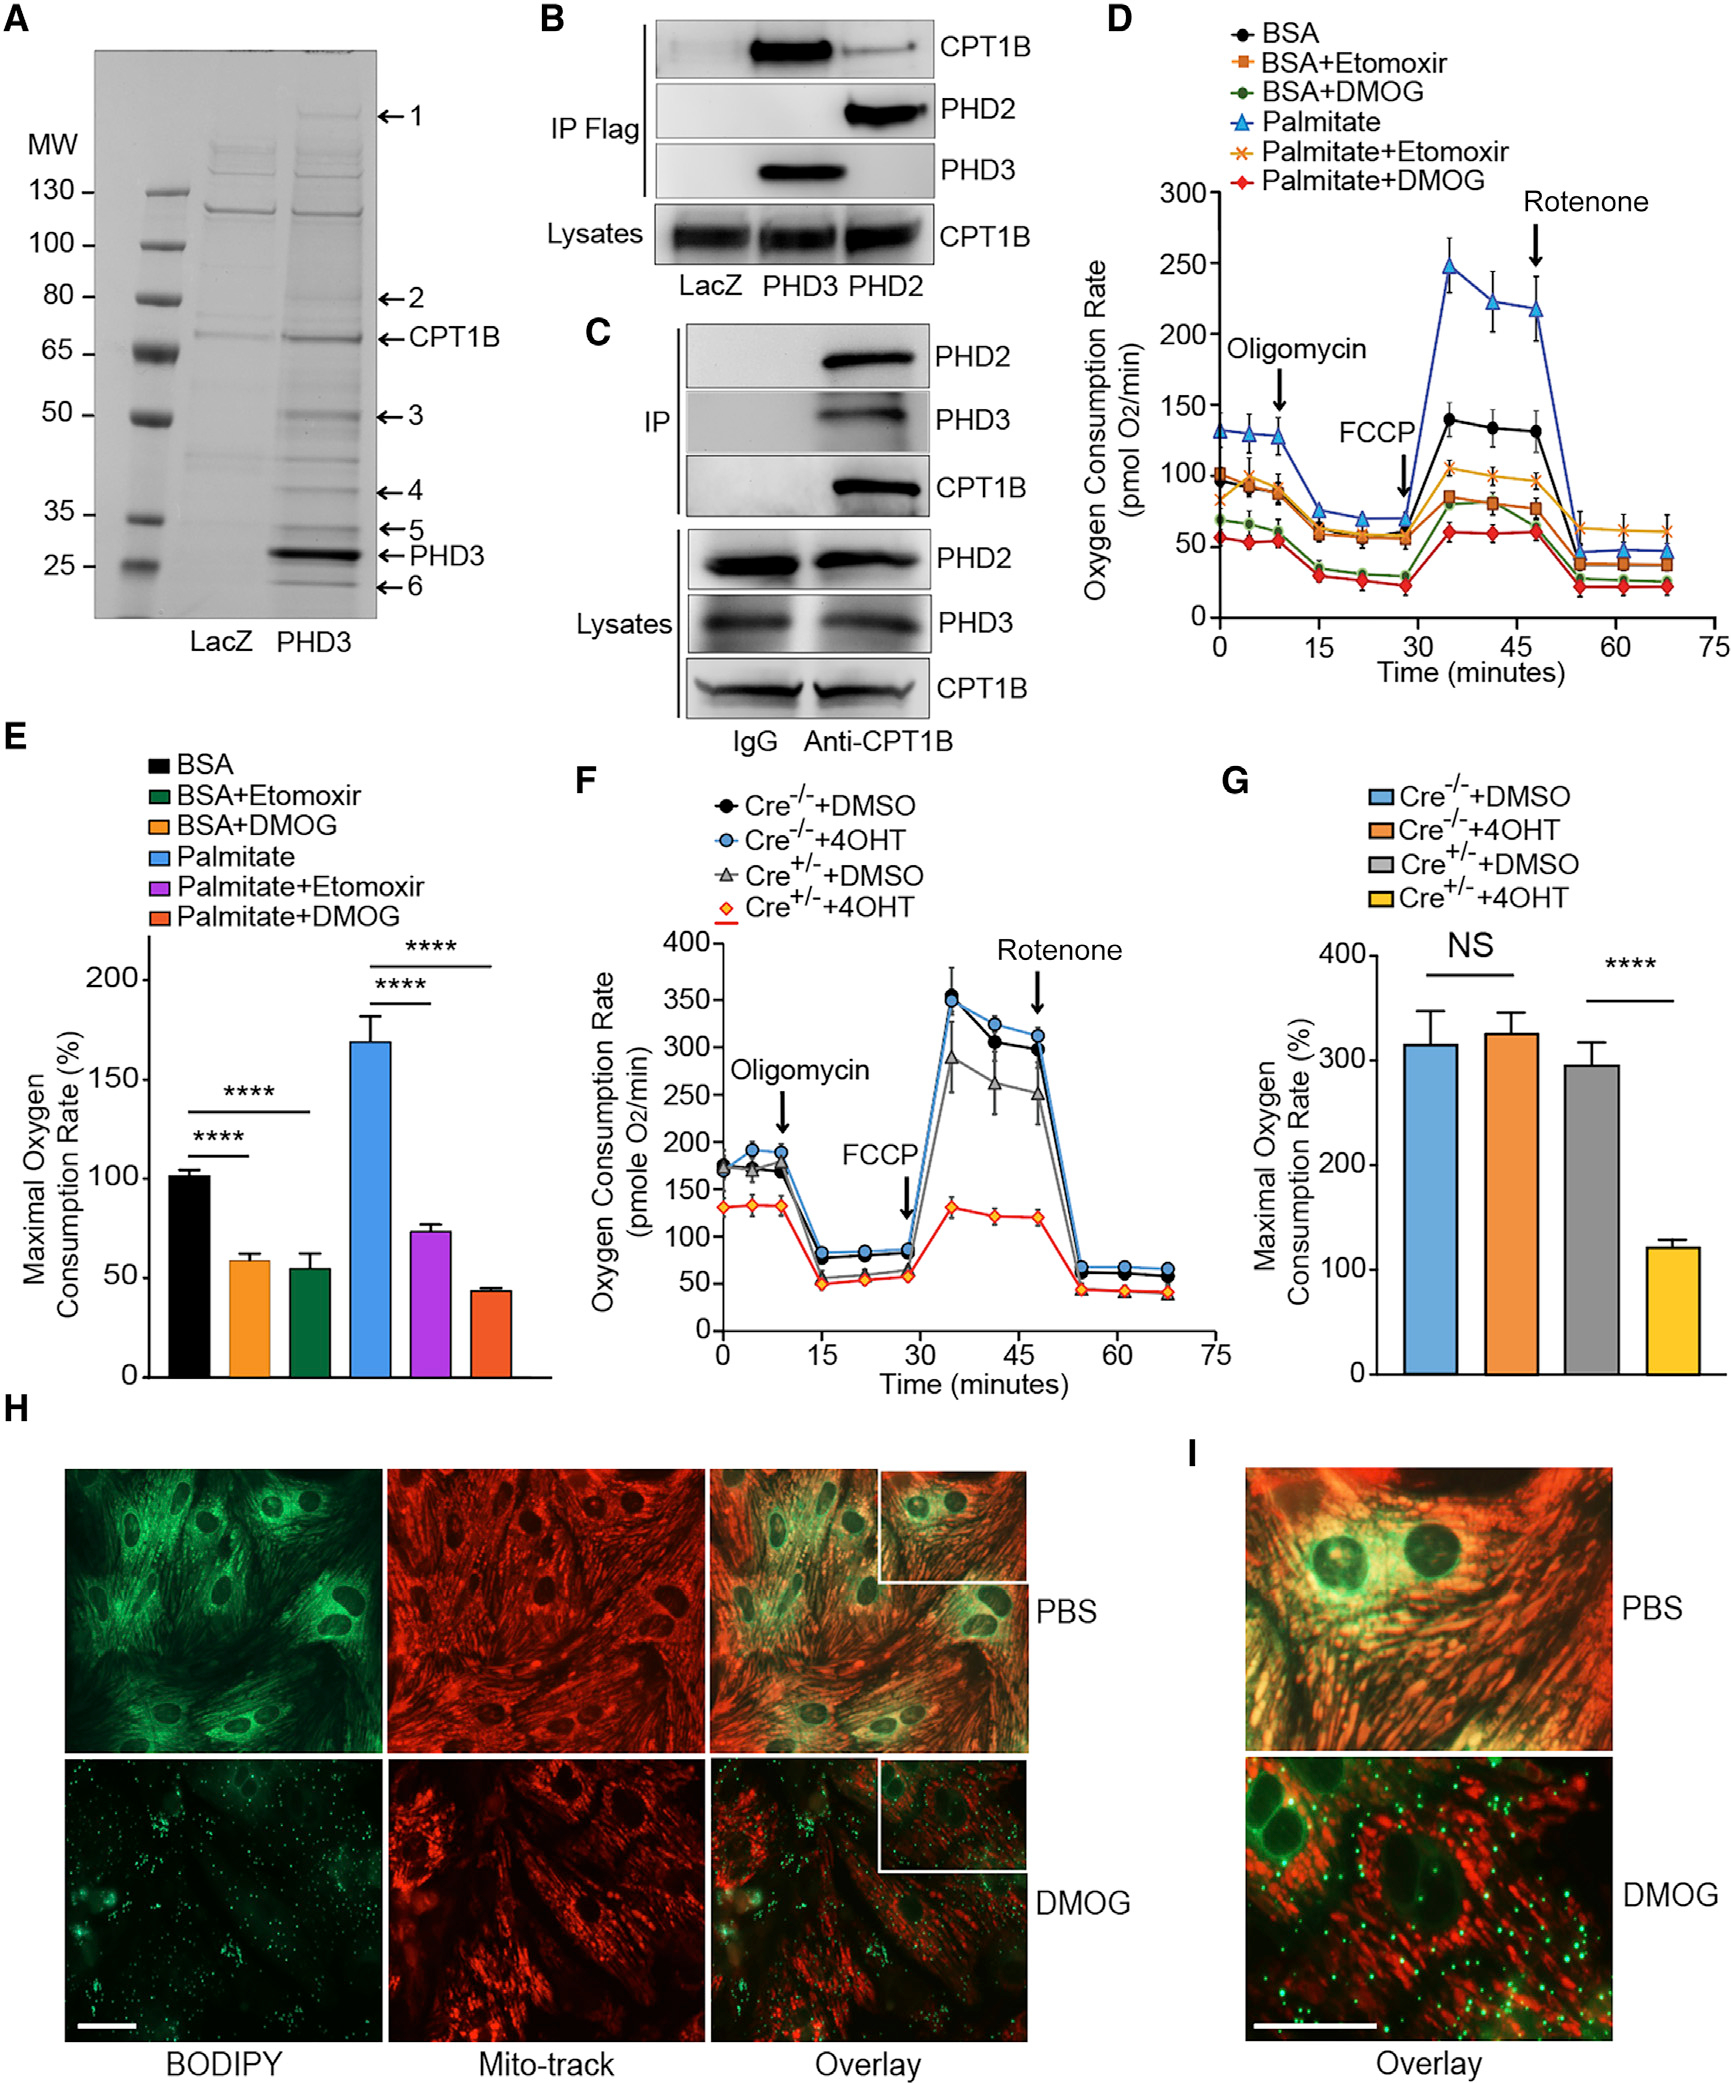
Figure 1. PHD2/3 bind to CPT1B and regulate LCFA uptake and oxidation in primary cardiomyocytes.

(A) Coomassie-stained SDS-PAGE of FLAG-PHD3 co-immunoprecipitated proteins in NRVMs. PHD3 or LacZ was overexpressed in NRVMs, and co-immunoprecipitation was performed with anti-FLAG agarose beads. Pulled-down proteins were separated with SDS-PAGE and visualized with G-250 Coomassie blue. Protein identities were determined by tandem mass spectrometry analysis (1. Dync1h1; 2. Na+/K+ ATPase α−1; 3. ATP synthase B; 4. GAPDH; 5. ANT; 6. MLP). The respective positions of PHD3 and CPT1B are labeled in the figure.
(B) Co-immunoprecipitation and western blot revealed PHD2 and 3 binding to CPT1B. FLAG-PHD2 and FLAG-PHD3 were immunoprecipitated by anti-FLAG beads, and the precipitated proteins were analyzed by western blot with anti-FLAG and anti-CPT1B antibodies.
(C) Co-immunoprecipitation and western blot revealed endogenous CPT1B binds to endogenous PHD2 and 3. The precipitated proteins were analyzed by western blot with anti-PHD2, PHD3, or CPT1B antibodies.
(D) Oxygen consumption rate (OCR) in primary cardiomyocytes after DMOG or Etomoxir (CPT1 inhibitor, Eto) treatment. OCR was real-time analyzed in living NRVMs by using a SeaHorse XFp Flux Analyzer. DMOG treatment leads to a drastic decrease in LC-FAO.
(E) Maximal respiration rate was estimated for each experimental group of cells.
(F and G) Similar experiment was conducted by using PHD2/3_HKO NMCMs. After 4 consecutive days of 4-hydroxyl-tamoxifen (4OHT) treatment to induce PHD2/3 disruption (or DMSO for untreated control cells), OCR was measured following the same protocol that described for NRVMs (F) and maximal respiration rate estimated afterward (G). A dramatic decrease in LC-FAO was found in PHD2/3-deficient cardiomyocytes, and maximal respiration rate was significantly decreased only in 4OHT treated PHD2/3_HKO NMCMs therefore in response to the loss of PHD2/3.
(H) Mitochondrial LCFA uptake in primary cardiomyocytes after DMOG treatment. Five days after seeding, NRVMs were cultured in serum free medium with 1 μM BODIPY 500/510 C12 in the presence of DMOG (1mM) or DMSO for 16 h (H, left panel). Mitochondria were labeled 5 with Mitotracker Red (H, middle panel).
(I) The same overlay of each experiment at a higher magnification.
Scale bars, 50 μm. For (D)–(G), results are shown ±SEM for an average of at least 4 different experiments: ****p < 0.0001.
