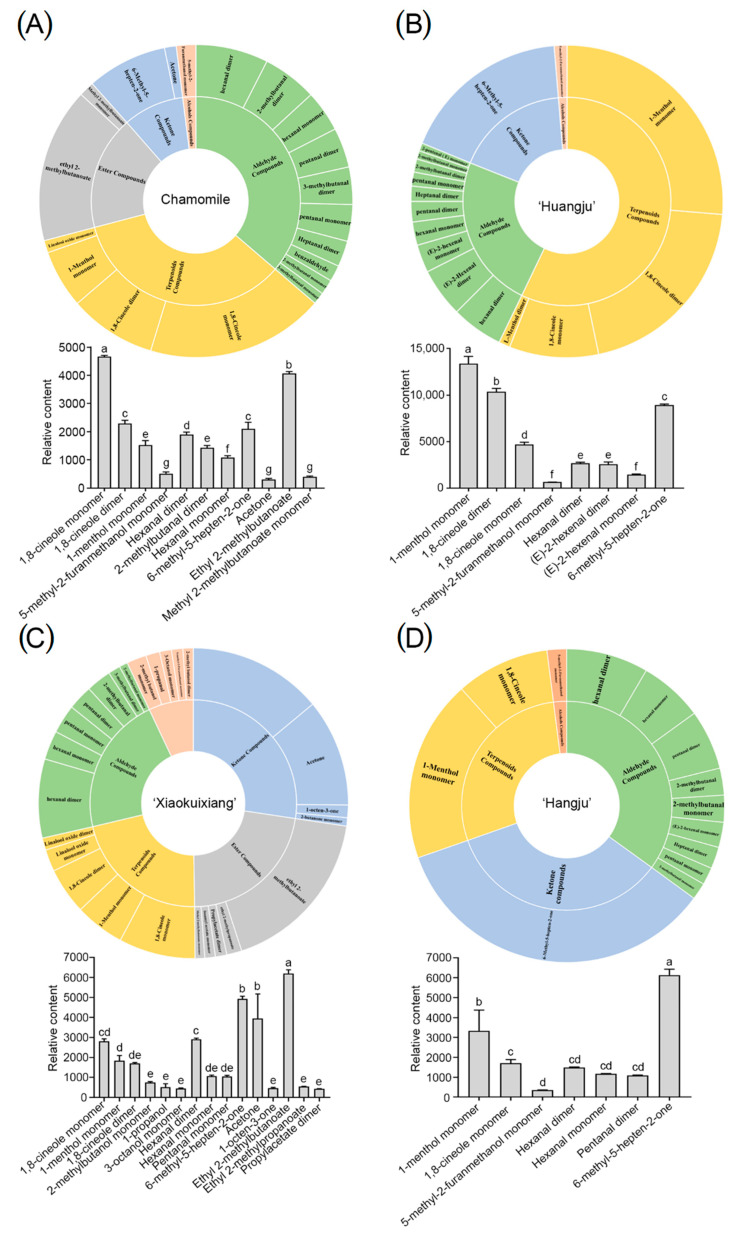
Figure 6.
The VOCs in the four chrysanthemum teas: (A) The pie chart and column VOCs of Chamomile; (B) the pie chart and column VOCs of ‘Huangju’; (C) the pie chart and column VOCs of ‘Xiaokuixiang’; (D) the pie chart and column VOCs of ‘Hangju’. Pie chart and column, (content > 300), error bars show the standard deviation between three biological replicates (n = 3). Three independent experiments were performed and error bars indicate standard deviations. Letters indicate significant differences which were determined by Duncan’s multiple range test (p < 0.05).

