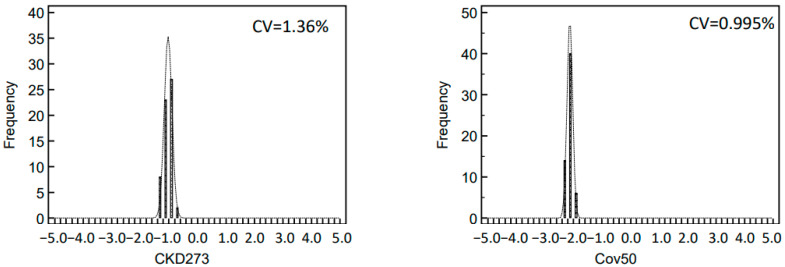
Figure 4.
Distribution of classification scores of selected biomarker panels. The left histogram depicts the classification scores of CKD273 for 60 measurements of the standard human urine sample. The right histogram depicts the classification score of Cov50 biomarker panel for the same set of measurements. None of the measurements scored positive in either panel. In addition, the coefficient of variation (CV) related to classification score range is given.

