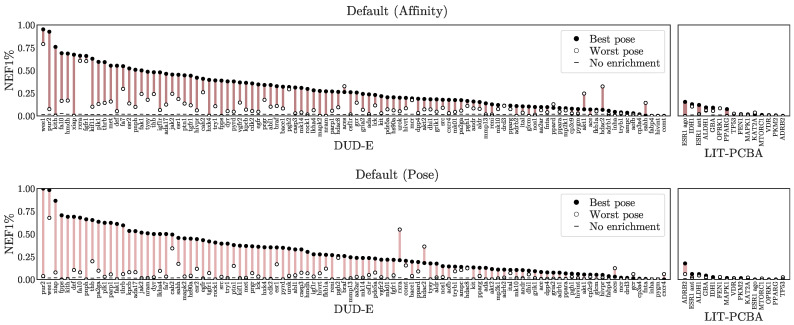
Figure 5.
Pose sensitivity assessment. For each target the NEF1% achieved using the best scoring pose is contrasted with the NEF1% achieved using the worst scoring pose using the Default ensemble to score. Additional models and metrics are shown in Figures S20 and S21. The x-axes are sorted independently by the NEF1% of the best scoring pose.

