Table 2.
Name, chemical structure, IC50 values of BTK and clinical phases of irreversible BTKIs under clinical and pre-clinical investigation.
| Name | Company | Chemical Structure |
IC50 or pIC50 Values on BTK |
Clinical Phases |
Ref |
|---|---|---|---|---|---|
| Evobrutinib | Merk | 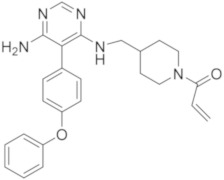 |
37.9 μM | Phase III | [29,30] |
| Spebrutinib | Avila Therapeutics/ Celegene |
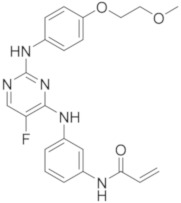 |
0.5 μM | Pre-clinical studies |
[35] |
| Remibrutinib | Novartis | 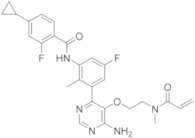 |
1.3 nM | Phase II | [36,37] |
| Tolebrutinib | Sanofi/Principia Biopharma | 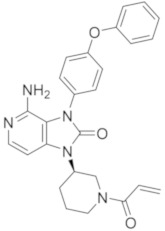 |
0.4–0.7 nM | Phase III | [38,39] |
| Olmutinib | Hamni Pharmaceuticals | 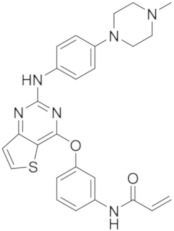 |
1.0 nM | Phase II | [13,40] |
| Branebrutinib | Bristol-Myers Squibb |
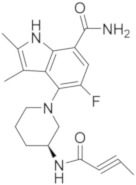 |
0.1 nM | Phase I | [41,42] |
| TAK-020 | Takeda | 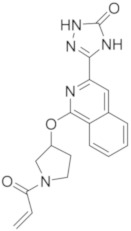 |
pIC50 > 8.7 | Phase I | [43,44] |
| Elsubrutinib | AbbVie | 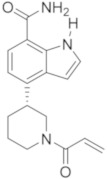 |
0.18 μM | Phase II | [45,46] |
| Rilzabrutinib | Sanofi | 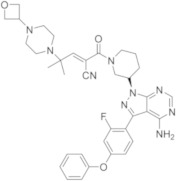 |
3.1 nM | Phase III | [4,7,14,47,48] |
