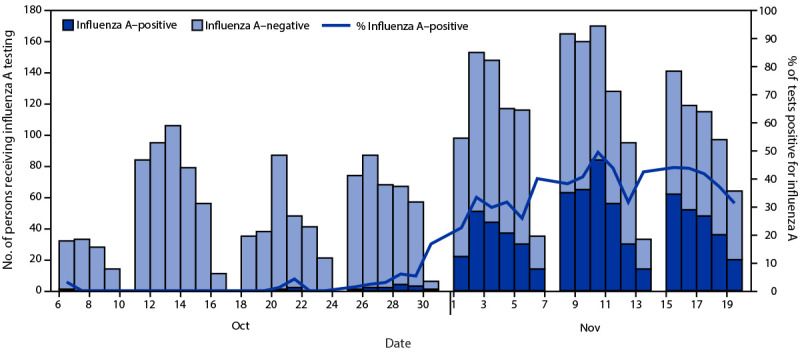
FIGURE.

Number of symptomatic persons who received testing for influenza A at University Health Service (N = 3,121)* and percentage of tests positive for influenza A, by date of influenza test† — University of Michigan, October 6–November 19, 2021
* Among persons who received testing more than once during October 6–November 19, 2021, the first influenza A–positive test result was used, or if the person never received an influenza A–positive result, the first negative test result was used.
† University Health Service does not conduct influenza A testing on Sundays.
