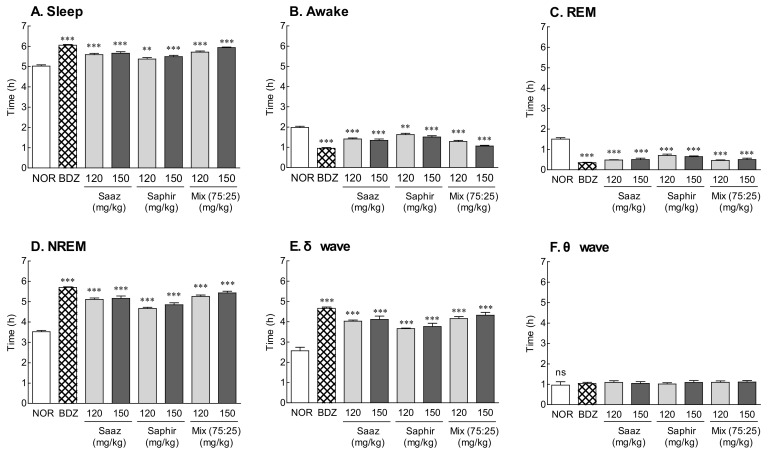
Figure 2.
Effects of hops (Saaz, Saphir, and Saaz–Saphir mixture) on the electrophysiologic pattern in rats. Electroencephalography (EEG) analyses were conducted for 9 days. (A) Sleep time, (B) awake time, (C) duration of REM, (D) duration of NREM, (E) δ wave of NREM, and (F) θ wave of NREM. NOR: the 0.9% NaCl (physiological saline) group (normal group), BDZ: benzodiazepine treatment (positive control, 200 μg/kg), Saaz (120 and 150 mg/kg), Saphir (120 and 150 mg/kg), and the Saaz–Saphir mixture (75:25, 120 and 150 mg/kg). Values are presented as the mean ± standard error of the mean (SEM) for each group, n = 8. Asterisks indicate significant differences: ** p < 0.01, and *** p < 0.001 vs. NOR by Tukey’s multiple comparison test. NS, not significant.

