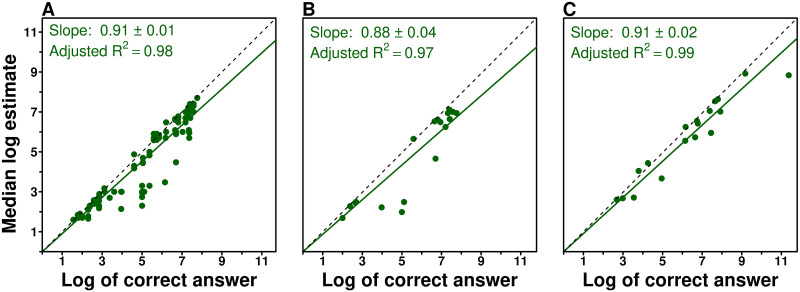
Fig 1. The relationship between the logarithm of the correct answer and the median of the logarithm of estimates for (a) 98 questions (one dot per question) taken from a former study [20] and (b, c) 36 questions from the current experiment.
Among the 36 questions, 18 were already asked in the above cited study (b) and 18 were new (c). The slopes of the linear regression lines are 0.91 (a), 0.88 (b) and 0.91 (c), underlining the robustness of this linear trend. Note that slopes lower than 1 reflect the underestimation bias.

