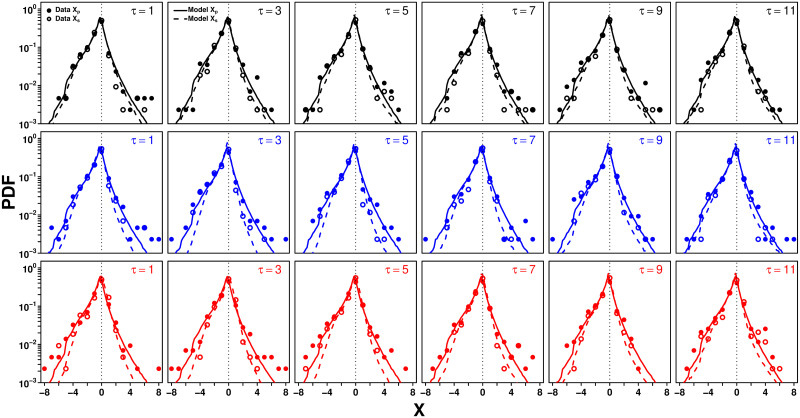
Fig 2. Probability density function (PDF) of personal estimates Xp (filled dots and solid lines) and second estimates Xs (empty dots and dashed lines) in the Random (black), Median (blue), and Shifted-Median (red) treatments, for each value of τ.
Dots are the data and lines correspond to model simulations.

