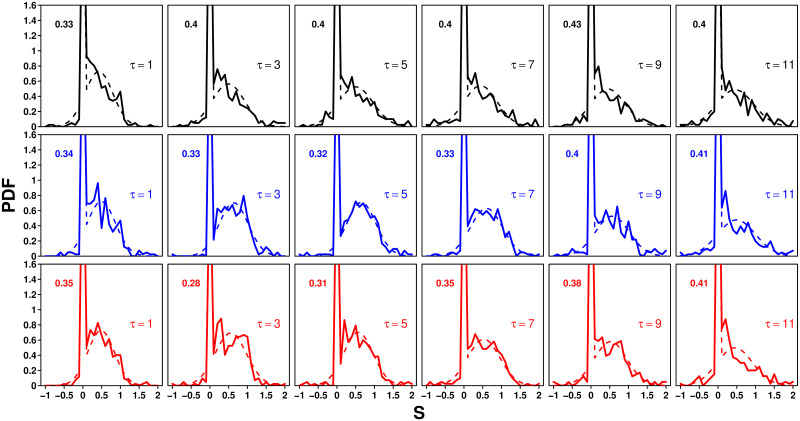
Fig 3. Probability density function (PDF) of sensitivities to social influence S in the Random (black), Median (blue), and Shifted-Median (red) treatments, for each value of τ.
Solid lines are experimental data, and dashed lines fits using Eq 2. The experimental probability P0 to keep one’s personal estimate (S = 0) is shown in the top left corner of each graph.

