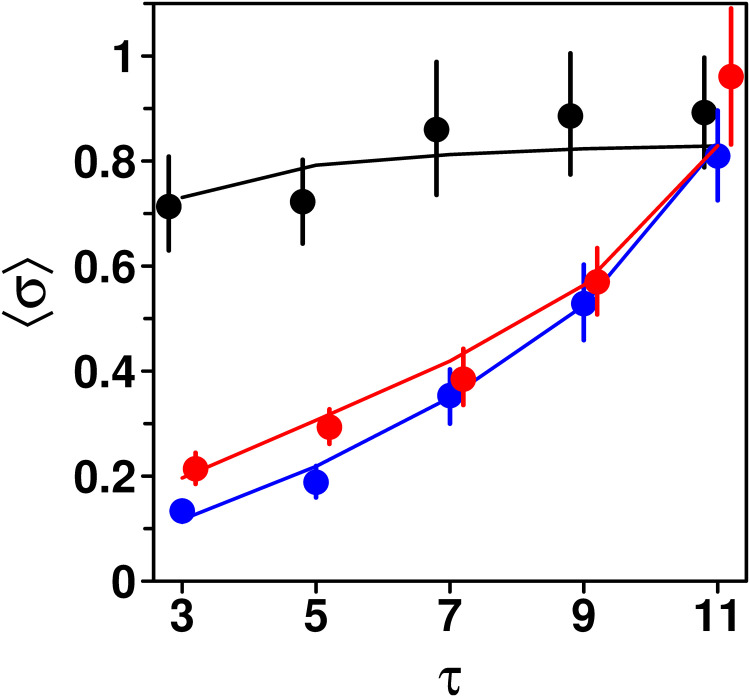
Fig 5. Average dispersion 〈σ〉 of the estimates received as social information against the number of shared estimates τ, in the Random (black), Median (blue), and Shifted-Median (red) treatments.
〈σ〉 is mostly independent of τ in the Random treatment, while it increases with τ in the Median and Shifted-Median treatments. Dots and error bars are the data, and solid lines correspond to model simulations.

