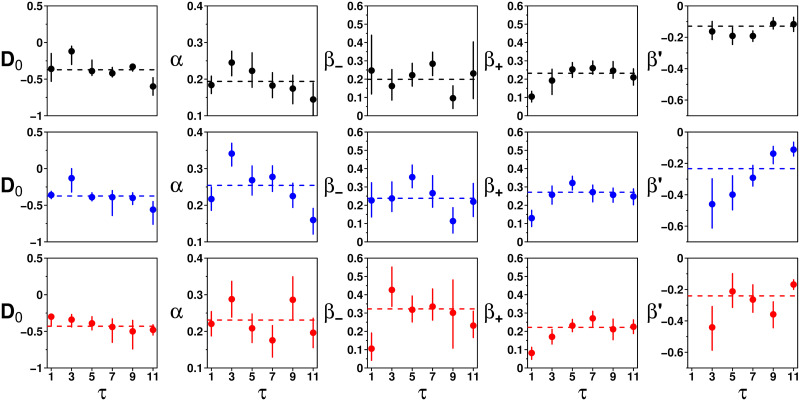
Fig 9. Fitted parameter values of D0, α, β−, β+, and β′ against τ in the Random (black), Median (blue), and Shifted-Median (red) treatments.
Dashed lines correspond to the average over all values of τ > 1. Parameters do not show any clear dependence on τ in each treatment (except possibly for β′ in the Median treatment) and are taken as independent of τ in the model, equal to their experimental mean.

