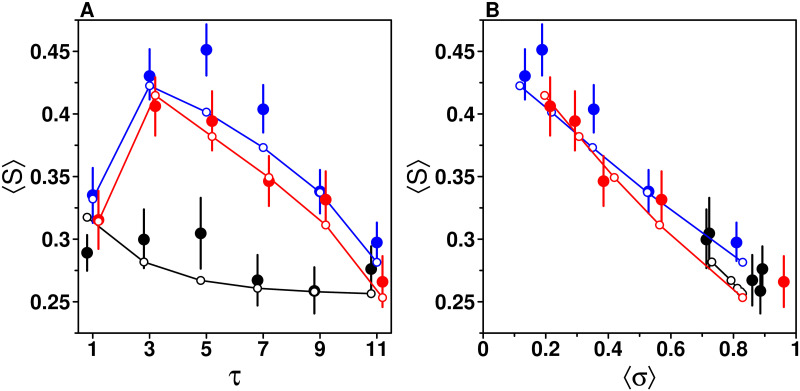
Fig 10. Average sensitivity to social influence 〈S〉 against (a) the number of shared estimates τ and (b) the average dispersion of estimates received 〈σ〉, in the Random (black), Median (blue), and Shifted-Median (red) treatments.
(a) In the Random treatment, there is only a minor dependence of 〈S〉 on τ. In the Median and Shifted-Median treatments, we find an inverse-U shape relationship with τ. This is due to the similarity effect, as shown in (b): a linear decrease of 〈S〉 with 〈σ〉 when τ > 1. Filled dots are the data, while empty dots and solid lines are model simulations.

