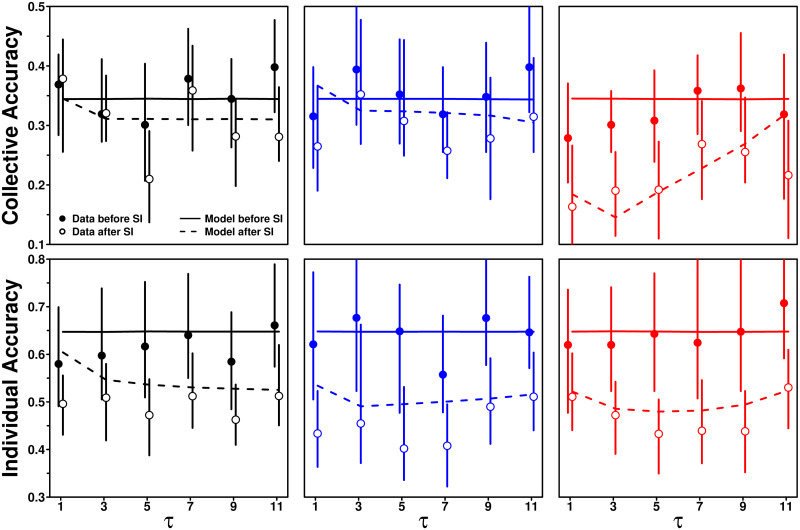
Fig 12. Collective and individual accuracy against the number of shared estimates τ, before (filled dots) and after (empty circles) social information sharing, in the Random (black), Median (blue), and Shifted-Median (red) treatments.
Values closer to 0 indicate higher accuracy. Solid and dashed lines are model simulations before and after social information sharing, respectively.

