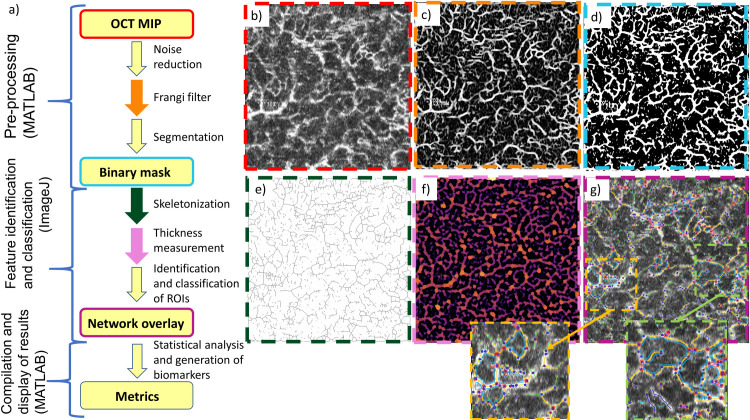
Fig 2. Flowchart of software workflow.
(a) and example images representing each step in the workflow (b-g). Colored borders in (b-g) correspond to the step with the matching-colored arrow or box in (a). OCTA MIP image (b) is loaded into OCTAVA. Images are first pre-processed in MATLAB to remove noise and enhance the signal intensity of vessel-like structures using a Frangi filter (c). Images are then segmented using the chosen segmentation algorithm to generate a binary mask (d). The image is then sent to ImageJ, where the network is skeletonized (e). The thickness and interconnectivity are measured (f), and the ROIs and network elements are identified and classified based on their thickness and interconnectivity. An overlay image is generated (g) which helps the user confirm that an accurate map of the network architecture was measured. Colors in (f) correspond to the local vessel thickness. Colors in (g) correspond to different architectural components of the network including segments (yellow lines), branches (green lines), mesh regions (light blue lines), isolated elements (dark blue lines), and nodes (red and blue circles). The insets in (g) allow a closer examination of the identified network elements. Finally, the outputs of the ImageJ analysis are sent to MATLAB, which generates and compiles metrics of the network. The large images in (b-g) are 5 mm × 5 mm. The insets in (g) are 1.6 mm × 1.6 mm.

