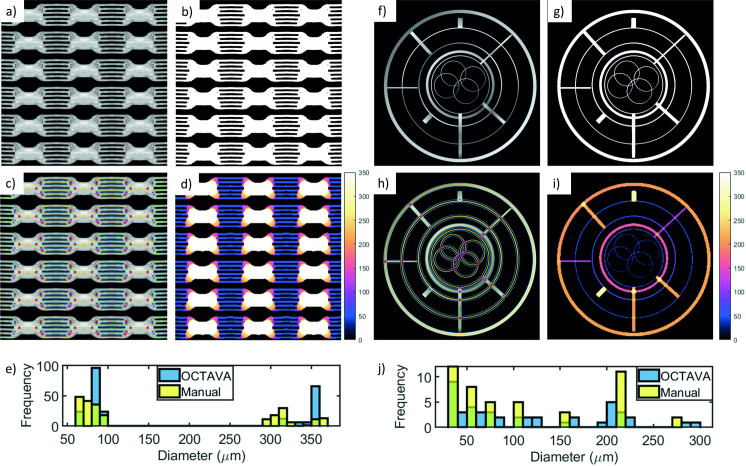
Fig 5. Validation of image processing steps and metric results using images of a microfluidic device.
(a-e) and a simulated OCTA MIP image (f-j). The composite image (a) is 4.32 mm × 4.32 mm with a pixel size of 4 μm. The binary mask (b) and overlay image (c) demonstrate the accuracy of the segmentation algorithm. The thickness map (d) demonstrates accurate measurement of the channel diameters throughout the image. The color bars in (d) and (i) indicate vessel diameter in μm. The green areas in the histogram indicate overlap between the blue and yellow bars. The same analysis was repeated for the simulated OCTA MIP image, which was assumed to be 10 mm × 10 mm with a pixel size of 9.3 μm. The overlay images (c, i) include a color-coded notation indicating different structures within the network: segments (yellow); branches (green); nodes (pink and blue circles); mesh regions (blue). (e) and (j) show the measured distribution of diameters in the microfluidic image and simulated OCTA MIP image, respectively. The larger channels in the microfluidic device are 300 μm and the smaller channels are 50 μm.

