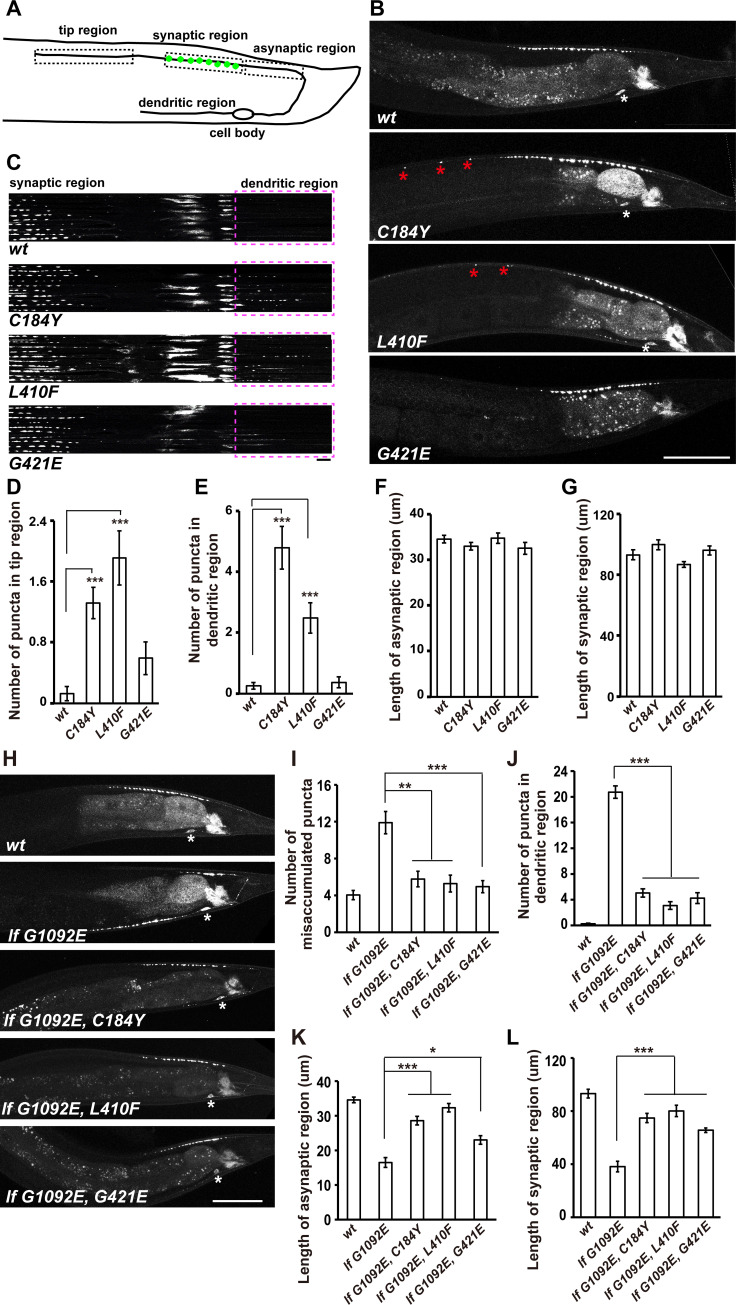
Fig 2. Abnormal synaptic vesicle accumulation in suppressor mutants.
(A) Schematic drawing of the DA9 neuron. Different regions of DA9 are boxed and labeled. The synaptic vesicle clusters (green) are indicated in the synaptic region. (B) Puncta formed by GFP::RAB-3 under the control of Pitr-1 appear in the tip region in unc-104(C184Y) and unc-104(L410F) animals (asterisks). Scale bar represents 50 μm. (C) GFP::RAB-3 signals appear in the dendritic region in unc-104(C184Y) and unc-104(L410F) animals. Line scan images of DA9 neurons. Ten DA9 neurons from independent animals were scanned and aligned. Scale bar represents 5 μm. Dashed boxes indicate the dendritic region. (D and E) Numbers of GFP::RAB-3 puncta in the tip region and the dendritic region. (F and G) Quantification of the length of the asynaptic region and the synaptic region. (H-L) The abnormal synaptic accumulation defect in unc-104(lf G1092E) could be suppressed by C184Y, L410F, or G421E mutation on UNC-104. (I) Quantification of the GFP::RAB-3 puncta in the asynaptic region and commissure region. (J) Quantification of the GFP::RAB-3 puncta in the dendritic region. (K and L) Quantification of the length of the asynaptic region and the synaptic region. *P<0.05, **P<0.01, ***P<0.001, one-way ANOVA with Tamhane’s T2 test. Mean ± SEM, N> = 19 worms for each genotype.

