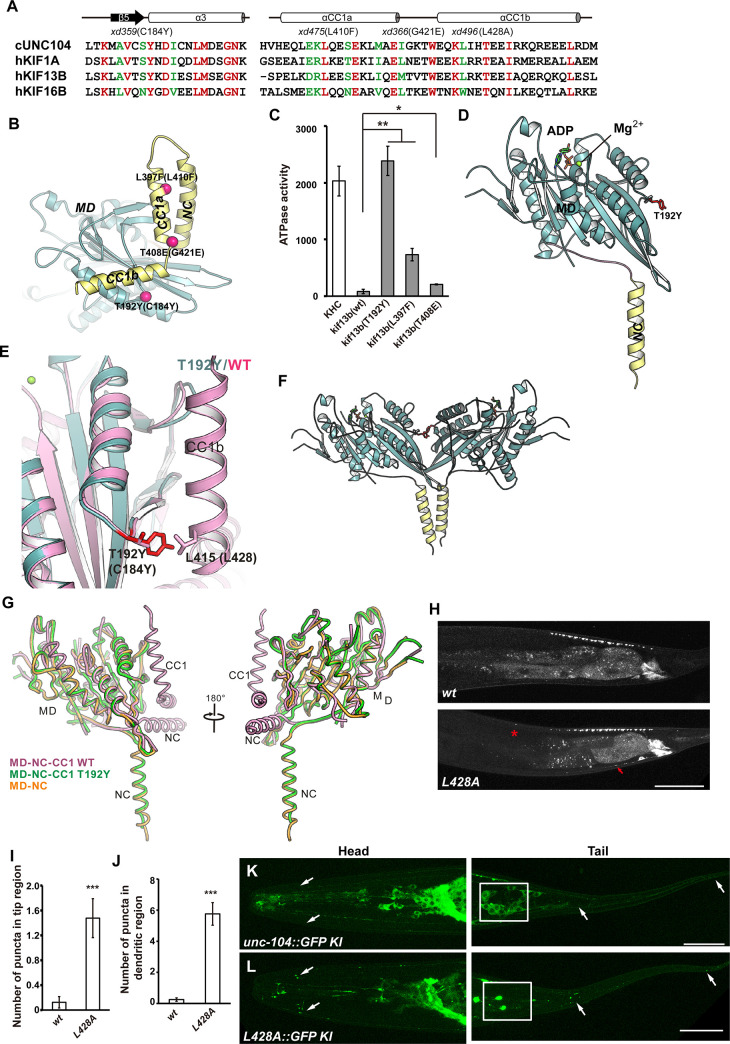
Fig 6. Conservation of the MD residues associated with autoinhibition.
(A) Structure-based sequence alignment of the binding regions between MD and NC-CC1. Identical residues are colored in red, and highly conserved residues in green. The secondary structures and residue numbers of UNC-104 are marked at the top. The mutation sites of xd359, xd475, xd366 and xd496 are also indicated. αCC1a and αCC1b are the two helixes within CC1. (B) Mapping of the mutation sites on the structure of KIF13B MD-NC-CC1. (C) Microtubule-stimulated ATPase activity of the KIF13B MD-NC-CC1 fragment containing the T192Y, L397F or T408E mutation. Bars represent Mean ± SD. n = 4 independent experiments, * P<0.05, one-way ANOVA with Tamhane’s T2 test. (D) A ribbon diagram of the structure of the T192Y-MD-NC-CC1 subunit. The motor domain, NL, NC and CC1 are colored in pale cyan, pink, yellow and light orange, respectively. The sidechain of T192Y is shown and highlighted in red. (E) Structural comparison of the T192Y-MD-NC-CC1 and MD-NC regions. The structure of the T192Y-MD-NC-CC1mutant dimer can be superimposed well on the active MD-NC dimer. (F) A ribbon diagram of the structure of the T192Y-MD-NC-CC1 dimer. (G) Structure-based comparison between the wild type (WT) MD-NC-CC1 and the mutant T192Y-MD-NC-CC1. (H) Puncta formed by GFP::RAB-3 under the control of Pitr-1 appear in the tip region in unc-104(L428A) animals (asterisks). Scale bar represents 50 μm. (I and J) Numbers of GFP::RAB-3 puncta in the tip region (I) and the dendritic region (J).***P<0.001, unpaired student t-test. Mean ± SEM, N> = 20. (K and L) Compared to wild type UNC-104::GFP KI (green), the UNC-104L428A::GFP is accumulated on neuronal processes and absent from the cell body region. Boxes indicate part of the ring ganglion (left) or pre-anal ganglion (right). White arrows indicate some of the neuronal termini. Scale bar represents 25 μm.

