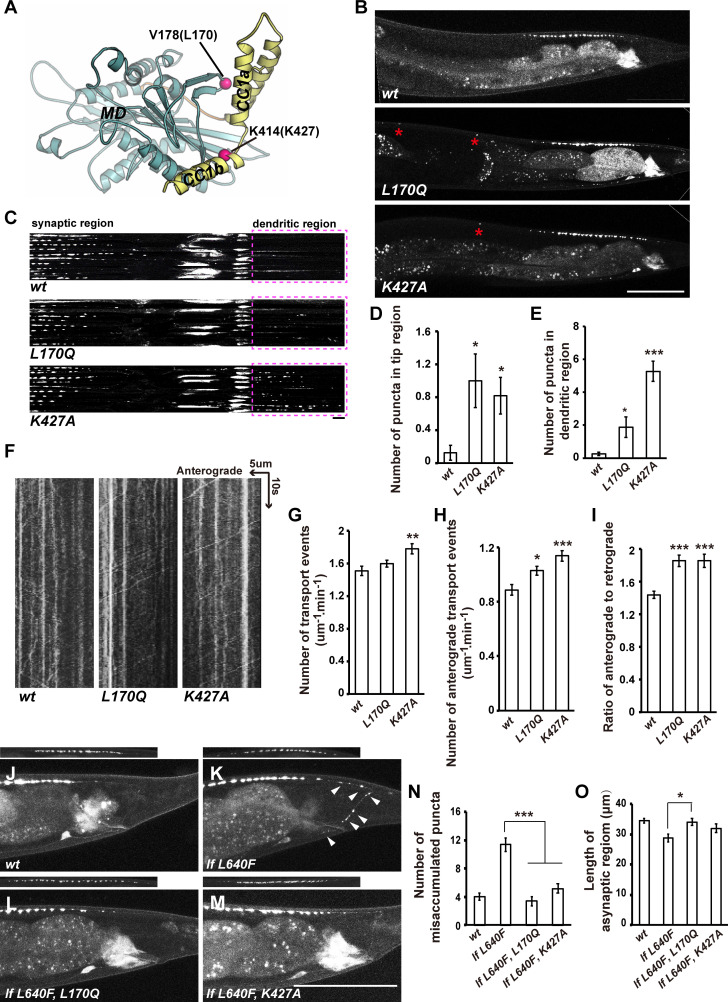
Fig 7. Mutations of the MD-CC1 interface lead to gain of function of UNC-104.
(A) Mapping of the mutation sites on the structure of KIF13B MD-NC-CC1. The L170Q and K427A mutations are indicated. (B) Puncta formed by GFP::RAB-3 (driven by Pitr-1) appear in the tip region of the DA9 neuron in unc-104(L170Q) and unc-104(K427A) animals (asterisks). Scale bar represents 50 μm. (C) GFP::RAB-3 puncta appear in the dendritic region of DA9 in unc-104(L170Q) and unc-104(K427A) animals. Line scan images of DA9 neurons. Ten DA9 neurons from independent animals were scanned and aligned. Scale bar represents 5 μm. Dashed boxes indicate the dendritic region. (D and E) The numbers of GFP::RAB-3 puncta in the tip region (D) and dendritic region (E).* P<0.05, *** P<0.001, one-way ANOVA with Tamhane’s T2 test. Mean ± SEM, n> = 20 for each genotype. (F) Representative kymograph images showing transport events of GFP::RAB-3 particles in the dorsal proximity region of DA9 neurons in wild type (wt), unc-104(L170Q) and unc-104(K427A) animals. Time and length are on the y axis and x axis, respectively. (G) The total number of transport events (anterograde plus retrograde) was measured by counting the number of GFP::RAB-3 particles that passed through a 1-μm zone during the 1-min monitoring period. (H) The number of anterograde movement events was measured by counting the number of GFP::RAB-3 particles moving in the anterograde direction through the 1-μm zone during the 1-min monitoring period. (I) The ratio of anterograde movements to retrograde movements. * P<0.05, ** P<0.01, *** P<0.001, one-way ANOVA with Tukey’s test. Mean ± SEM, N = 30 for each genotype. (J-M) The abnormal synaptic accumulation defect in unc-104(lf L640F) could be suppressed by L170Q or K427A mutation on UNC-104. The synaptic region is shown on the top. Scale bar represents 25 μm. (N) Quantification of the misaccumulated GFP::RAB-3 puncta in the asynaptic and commissure regions. (O) Quantification of the length of the asynaptic region. *P<0.05, ***P<0.001, one-way ANOVA with Tamhane’s T2 test. Mean ± SEM, N> = 20 worms for each genotype.

