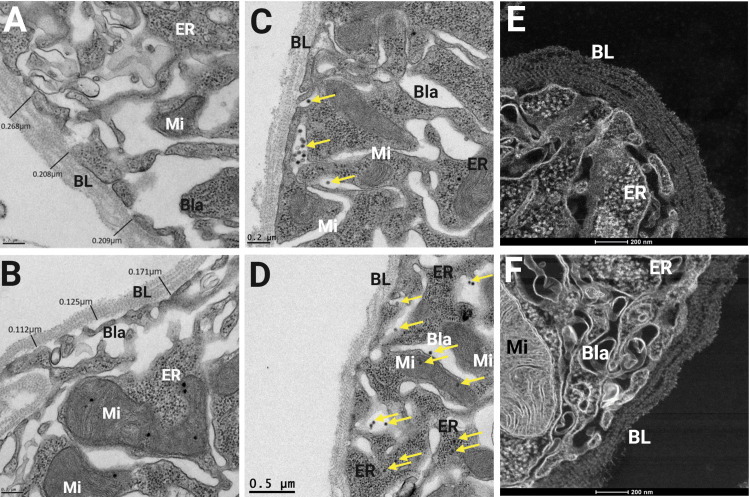
Fig 1. Ultrastructural (TEM) visualization of the midgut BL in Starve and Control Ae. aegypti (HWE).
Midguts of Starve and Control Ae. aegypti were dissected at 3 and 5 days post-infection (dpi) via ingestion of a ZIKV-containing blood-meal and visualized by transmission electron microscopy (TEM). TEM images of (A) Control and (B) Starve midguts are shown with BL width measurements at 5 dpi. (C) Multiple virions are accumulating in the basal labyrinth of a Starve midgut at 3 dpi (yellow arrows). (D) ZIK virions are shown in a Control midgut both in the basal labyrinth and in the endoplasmic reticulum at 5 dpi. (E) Scanning transmission electron microscopy (STEM) images showing a higher number of individual BL strands of a Control midgut at 5 dpi when compared to the (F) BL of a Starve midgut. BL = basal lamina, Bla = basal labyrinth, ER = endoplasmic reticulum, Mi = mitochondria. TEM images were captured using a JEOL JEM 1400 transmission electron microscope and STEM images were captured using a ThermoFisher Tecnai F30 Twin 300kV transmission electron microscope/scanning transmission electron microscope.

