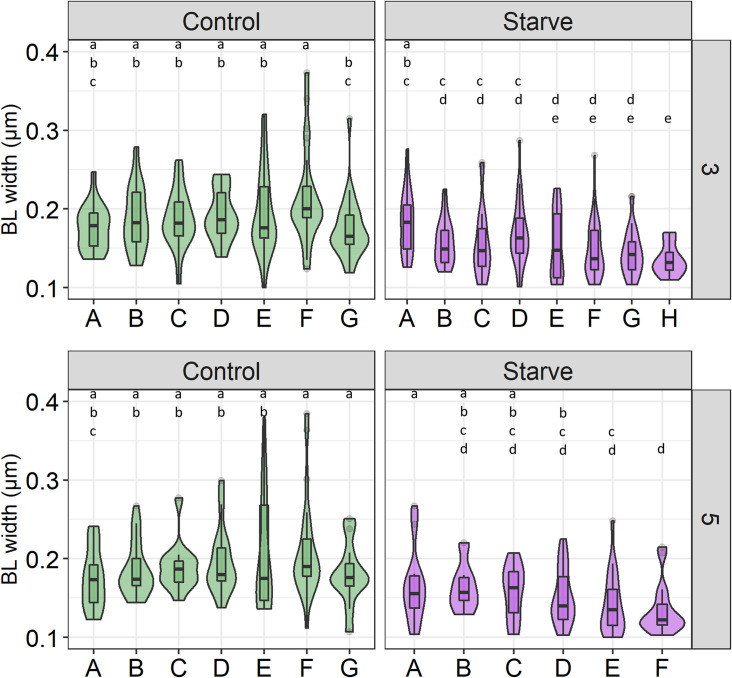
Fig 2. Distribution of midgut basal lamina (BL) width in individual midguts of Control and Starve Ae. aegypti HWE.
Five day-old Ae. aegypti HWE Control and Starve mosquitoes were fed a ZIKV-containing blood-meal and the ultrastructure of the midgut BL was visualized at 3 and 5 days post-infection (dpi). TEM images were obtained from 6–8 Control and Starve midguts per timepoint (Midguts A-H). ImageJ was used to take three measurements of the BL width per image. Each BL measurement was plotted in the violin plot representing the distribution of BL width per midgut at 3 dpi and 5 dpi. The boxplot within the violin plot represents the median, upper and lower quartiles, and extremities. Kruskal Wallis and post-hoc Dunn Test were used for statistical analysis. Significance is shown by different letters (p < 0.05).

